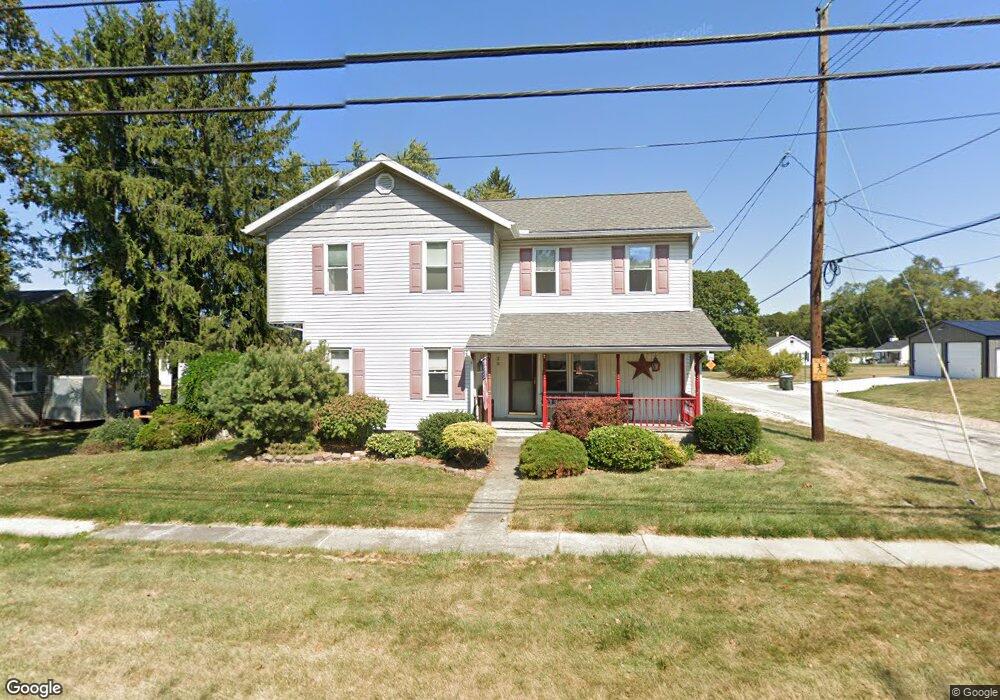
20 Main St Luckey, OH 43443
Estimated Value: $204,000 - $223,000
3
Beds
2
Baths
1,754
Sq Ft
$122/Sq Ft
Est. Value
About This Home
This home is located at 20 Main St, Luckey, OH 43443 and is currently estimated at $214,151, approximately $122 per square foot. 20 Main St is a home with nearby schools including Eastwood Middle School and Eastwood High School.
Ownership History
Date
Name
Owned For
Owner Type
Purchase Details
Closed on
Apr 17, 2017
Sold by
Brockschmidt Sue Ann
Bought by
Brockschmidt Bradley T
Current Estimated Value
Purchase Details
Closed on
Mar 28, 2002
Sold by
Brockschmidt Norman J and Brockschmidt Evelyn
Bought by
Brockschmidt Bradley T and Brockschmidt Sue Ann
Home Financials for this Owner
Home Financials are based on the most recent Mortgage that was taken out on this home.
Original Mortgage
$90,000
Outstanding Balance
$35,902
Interest Rate
7%
Estimated Equity
$178,249
Purchase Details
Closed on
Jan 24, 1986
Bought by
Brockschmidt Norman J
Create a Home Valuation Report for This Property
The Home Valuation Report is an in-depth analysis detailing your home's value as well as a comparison with similar homes in the area
Purchase History
| Date | Buyer | Sale Price | Title Company |
|---|---|---|---|
| Brockschmidt Bradley T | -- | None Available | |
| Brockschmidt Bradley T | $90,000 | -- | |
| Brockschmidt Norman J | -- | -- |
Source: Public Records
Mortgage History
| Date | Status | Borrower | Loan Amount |
|---|---|---|---|
| Open | Brockschmidt Bradley T | $90,000 |
Source: Public Records
Tax History
| Year | Tax Paid | Tax Assessment Tax Assessment Total Assessment is a certain percentage of the fair market value that is determined by local assessors to be the total taxable value of land and additions on the property. | Land | Improvement |
|---|---|---|---|---|
| 2025 | $1,974 | $48,440 | $5,425 | $43,015 |
| 2024 | $1,853 | $48,440 | $5,425 | $43,015 |
| 2023 | $1,853 | $48,450 | $5,430 | $43,020 |
| 2021 | $1,710 | $40,360 | $5,430 | $34,930 |
| 2020 | $1,726 | $40,360 | $5,430 | $34,930 |
| 2019 | $1,597 | $35,810 | $5,430 | $30,380 |
| 2018 | $1,594 | $35,810 | $5,430 | $30,380 |
| 2017 | $1,808 | $35,810 | $5,430 | $30,380 |
| 2016 | $1,409 | $34,130 | $5,430 | $28,700 |
| 2015 | $1,409 | $34,130 | $5,430 | $28,700 |
| 2014 | $2,200 | $34,130 | $5,430 | $28,700 |
| 2013 | $2,239 | $34,130 | $5,430 | $28,700 |
Source: Public Records
Map
Nearby Homes
- 0 Lemoyne Rd Unit 10003312
- 0 Pemberville Rd
- 420 Linden Dr
- 424 Linden Dr
- 423 Linden Dr
- 449 Linden Dr
- 425 Linden Dr
- 426 Linden Dr
- 421 Linden Dr
- 451 Linden Dr
- 447 Linden Dr
- 459 Linden Dr
- 427 Linden Dr
- 443 W College Ave Unit 443
- 432 Linden St
- 428 Linden Drive (Lot 9)
- 123 Catalpa (Lot 21) Ct
- 214 Main St
- 455 Linden (Lot 42) Dr
- 127 Bierley Ave
Your Personal Tour Guide
Ask me questions while you tour the home.