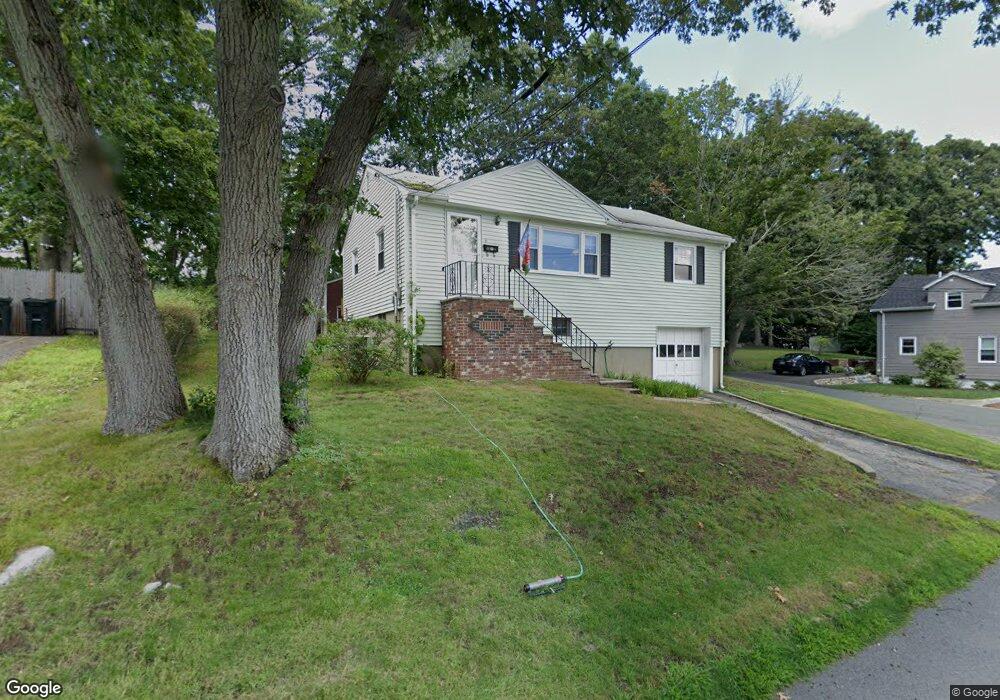
20 Maple Ave Woburn, MA 01801
Downtown Woburn NeighborhoodEstimated Value: $603,000 - $643,000
2
Beds
1
Bath
936
Sq Ft
$657/Sq Ft
Est. Value
About This Home
This home is located at 20 Maple Ave, Woburn, MA 01801 and is currently estimated at $614,743, approximately $656 per square foot. 20 Maple Ave is a home located in Middlesex County with nearby schools including Malcolm White Elementary School, John F. Kennedy Middle School, and Woburn High School.
Ownership History
Date
Name
Owned For
Owner Type
Purchase Details
Closed on
Jul 3, 2018
Sold by
Flagg Stephen P
Bought by
Flagg Stephen P and Flagg Denise S
Current Estimated Value
Purchase Details
Closed on
Dec 3, 1999
Sold by
Agrawal Alpana and Agrawal Vimal K
Bought by
Flagg Stephen P
Home Financials for this Owner
Home Financials are based on the most recent Mortgage that was taken out on this home.
Original Mortgage
$152,400
Interest Rate
7.86%
Mortgage Type
Purchase Money Mortgage
Purchase Details
Closed on
Jul 24, 1995
Sold by
Wood Ronald A
Bought by
Agrawal Alpana and Agrawal Vimal K
Home Financials for this Owner
Home Financials are based on the most recent Mortgage that was taken out on this home.
Original Mortgage
$100,000
Interest Rate
7.49%
Mortgage Type
Purchase Money Mortgage
Create a Home Valuation Report for This Property
The Home Valuation Report is an in-depth analysis detailing your home's value as well as a comparison with similar homes in the area
Home Values in the Area
Average Home Value in this Area
Purchase History
| Date | Buyer | Sale Price | Title Company |
|---|---|---|---|
| Flagg Stephen P | -- | -- | |
| Flagg Stephen P | -- | -- | |
| Flagg Stephen P | $190,500 | -- | |
| Agrawal Alpana | $125,000 | -- |
Source: Public Records
Mortgage History
| Date | Status | Borrower | Loan Amount |
|---|---|---|---|
| Previous Owner | Agrawal Alpana | $152,400 | |
| Previous Owner | Agrawal Alpana | $100,000 | |
| Previous Owner | Agrawal Alpana | $23,000 | |
| Closed | Agrawal Alpana | $19,050 |
Source: Public Records
Tax History Compared to Growth
Tax History
| Year | Tax Paid | Tax Assessment Tax Assessment Total Assessment is a certain percentage of the fair market value that is determined by local assessors to be the total taxable value of land and additions on the property. | Land | Improvement |
|---|---|---|---|---|
| 2025 | $4,160 | $487,100 | $289,100 | $198,000 |
| 2024 | $3,815 | $473,300 | $275,300 | $198,000 |
| 2023 | $3,939 | $452,800 | $250,300 | $202,500 |
| 2022 | $3,824 | $409,400 | $217,600 | $191,800 |
| 2021 | $3,605 | $386,400 | $207,300 | $179,100 |
| 2020 | $3,392 | $364,000 | $207,300 | $156,700 |
| 2019 | $3,215 | $338,400 | $197,400 | $141,000 |
| 2018 | $3,096 | $313,000 | $181,100 | $131,900 |
| 2017 | $2,984 | $300,200 | $172,500 | $127,700 |
| 2016 | $2,875 | $286,100 | $161,200 | $124,900 |
| 2015 | $2,760 | $271,400 | $150,700 | $120,700 |
| 2014 | $2,599 | $248,900 | $150,700 | $98,200 |
Source: Public Records
Map
Nearby Homes
- 74 Beach St Unit 6-12
- 74 Beach St Unit 3
- 52 Middle St
- 38 Middle St
- 0 Fryeburg Rd
- 12 Mishawum Rd
- 8 Clinton St
- 18 Church St Unit 2
- 602 Main St Unit 1
- 14 Church Ave
- 14 Church Ave Unit 2
- 3 Highet Ave
- 1 Boline Place
- 9 Wade Ave
- 2 Eastern Ave
- 18 Gardner Ave
- 166 Place Ln Unit 166
- 168 Place Ln
- 477 Main St
- 3 Hart St