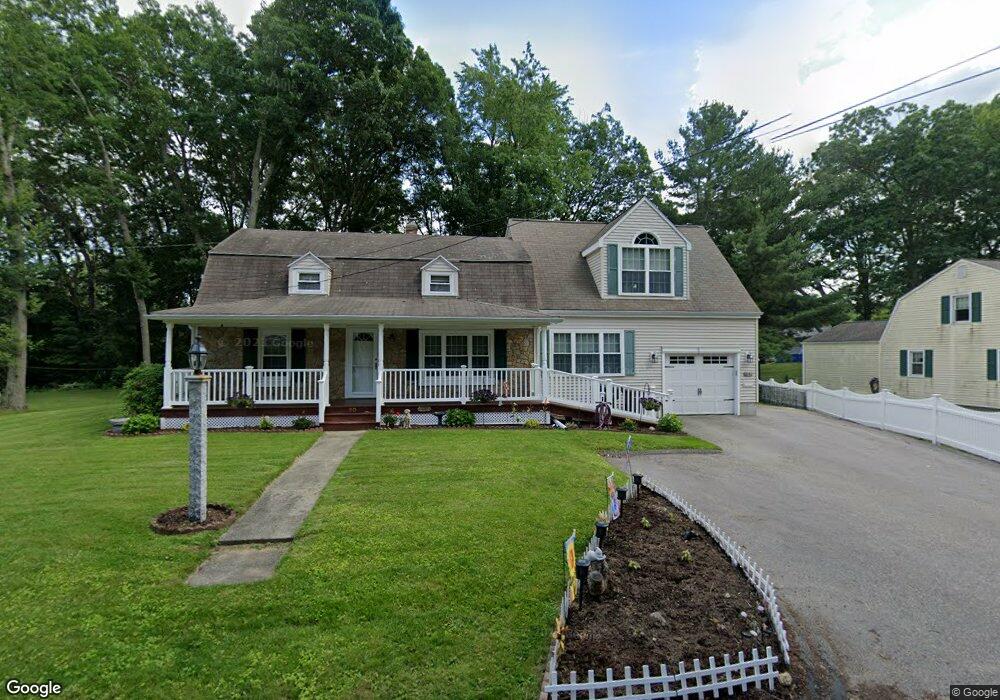
20 Marion Ave Auburn, MA 01501
Downtown Auburn NeighborhoodEstimated Value: $544,000 - $602,000
3
Beds
3
Baths
2,230
Sq Ft
$253/Sq Ft
Est. Value
About This Home
This home is located at 20 Marion Ave, Auburn, MA 01501 and is currently estimated at $564,472, approximately $253 per square foot. 20 Marion Ave is a home located in Worcester County with nearby schools including Auburn Senior High School and Shrewsbury Montessori School - Auburn Campus.
Ownership History
Date
Name
Owned For
Owner Type
Purchase Details
Closed on
May 19, 2005
Sold by
Connolly Elizabeth B
Bought by
Connolly Catherine M
Current Estimated Value
Home Financials for this Owner
Home Financials are based on the most recent Mortgage that was taken out on this home.
Original Mortgage
$100,000
Outstanding Balance
$52,509
Interest Rate
5.95%
Mortgage Type
Purchase Money Mortgage
Estimated Equity
$511,963
Create a Home Valuation Report for This Property
The Home Valuation Report is an in-depth analysis detailing your home's value as well as a comparison with similar homes in the area
Home Values in the Area
Average Home Value in this Area
Purchase History
| Date | Buyer | Sale Price | Title Company |
|---|---|---|---|
| Connolly Catherine M | $130,000 | -- |
Source: Public Records
Mortgage History
| Date | Status | Borrower | Loan Amount |
|---|---|---|---|
| Open | Connolly Catherine M | $100,000 |
Source: Public Records
Tax History Compared to Growth
Tax History
| Year | Tax Paid | Tax Assessment Tax Assessment Total Assessment is a certain percentage of the fair market value that is determined by local assessors to be the total taxable value of land and additions on the property. | Land | Improvement |
|---|---|---|---|---|
| 2025 | $68 | $478,300 | $137,300 | $341,000 |
| 2024 | $7,464 | $499,900 | $130,600 | $369,300 |
| 2023 | $7,113 | $447,900 | $118,700 | $329,200 |
| 2022 | $6,563 | $390,200 | $118,700 | $271,500 |
| 2021 | $6,344 | $349,700 | $104,700 | $245,000 |
| 2020 | $6,288 | $349,700 | $104,700 | $245,000 |
| 2019 | $5,907 | $320,700 | $103,700 | $217,000 |
| 2018 | $3,862 | $322,900 | $96,900 | $226,000 |
| 2017 | $5,448 | $313,900 | $87,900 | $226,000 |
| 2016 | $5,429 | $300,100 | $92,300 | $207,800 |
| 2015 | $4,957 | $287,200 | $92,300 | $194,900 |
| 2014 | $4,751 | $274,800 | $87,900 | $186,900 |
Source: Public Records
Map
Nearby Homes