
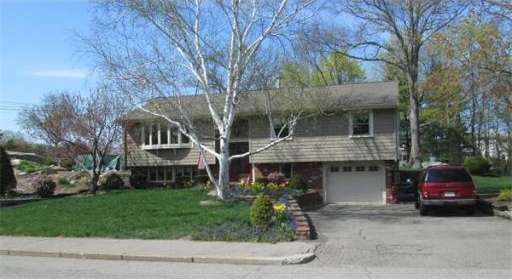

20 Marks Rd East Weymouth, MA 02189
4
Beds
3
Baths
2,500
Sq Ft
0.43
Acres
About This Home
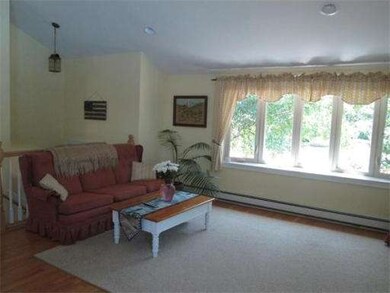
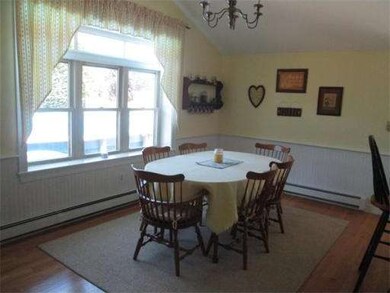
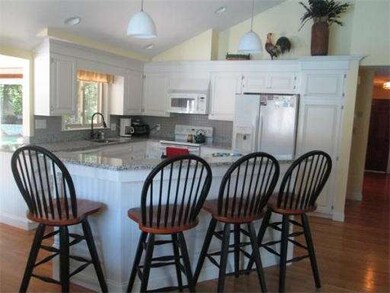
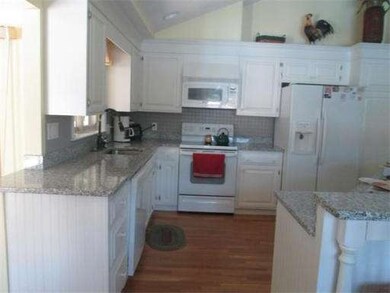
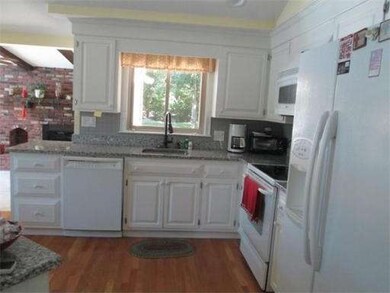
As of May 2025LOCATION! LOCATION! LOCATION! This 2900 sf+ home is located in one of Weymouth's most sought after neighborhoods. 10 RM, 4BR, 2.5 BA, open floor plan, cathedral ceilings, Hardwood Flooring, granite tops, 12ft fireplace, premium vinyl shake siding, new windows, Above Ground pool, professional landscaped, on cul de sac. PERFECT set-up for in-law and/or au-pair! Close to train, bus, x-way. So much more! Must be seen! Open Houses - SATURDAY & SUNDAY's 12:00 - 3:00
Home Details
Home Type
Single Family
Est. Annual Taxes
$7,476
Year Built
1971
Lot Details
0
Interior Features
- Has Basement: Yes
- Fireplaces: 1
- Number of Rooms: 10
- Amenities: Public Transportation
- Electric: 200 Amps
- Flooring: Wood
- Basement: Full
- Bedroom 2: First Floor, 10X14
- Bedroom 3: First Floor, 10X10
- Bedroom 4: Basement, 12X17
- Bathroom #1: First Floor, 5X11
- Bathroom #2: First Floor, 6X9
- Bathroom #3: Basement, 5X8
- Kitchen: First Floor
- Laundry Room: Basement, 4X10
- Living Room: First Floor, 20X28
- Master Bedroom: First Floor, 14X14
- Dining Room: First Floor
- Family Room: Basement, 12X24
Exterior Features
- Construction: Frame
- Exterior: Vinyl
- Exterior Features: Deck, Patio, Pool - Above Ground, Gutters, Storage Shed
- Foundation: Poured Concrete
Garage/Parking
- Garage Parking: Under
- Garage Spaces: 1
- Parking Spaces: 4
Utilities
- Heat Zones: 3
- Hot Water: Electric
Ownership History
Date
Name
Owned For
Owner Type
Purchase Details
Listed on
Feb 25, 2025
Closed on
May 7, 2025
Sold by
Pitts Maureen and Pitts Herbert
Bought by
Lee Joo H and Lee Ashley
Seller's Agent
Heather Roy
William Raveis R.E. & Home Services
Buyer's Agent
Chris Remmes Group
Remmes & Co.
List Price
$830,000
Sold Price
$840,000
Premium/Discount to List
$10,000
1.2%
Views
119
Home Financials for this Owner
Home Financials are based on the most recent Mortgage that was taken out on this home.
Avg. Annual Appreciation
-7.93%
Original Mortgage
$672,000
Outstanding Balance
$670,817
Interest Rate
6.65%
Mortgage Type
Purchase Money Mortgage
Estimated Equity
$152,006
Purchase Details
Closed on
Dec 26, 2014
Sold by
Larocco Robert M and Larocco Diane
Bought by
Pitts Maureen and Pitts Herbert
Purchase Details
Listed on
Jul 29, 2014
Closed on
Oct 10, 2014
Sold by
Larocco Robert M and Larocco Diane D
Bought by
Potts Maureen and Potts Herbert
Seller's Agent
Dan DiRenzo
Realty Choice, Inc.
Buyer's Agent
Dan DiRenzo
Realty Choice, Inc.
List Price
$509,900
Sold Price
$489,900
Premium/Discount to List
-$20,000
-3.92%
Home Financials for this Owner
Home Financials are based on the most recent Mortgage that was taken out on this home.
Avg. Annual Appreciation
4.90%
Purchase Details
Closed on
Aug 17, 2012
Sold by
Larocco Robert M and Larocco Diane D
Bought by
Connors Michelle and Kelley Kristina
Similar Homes in East Weymouth, MA
Create a Home Valuation Report for This Property
The Home Valuation Report is an in-depth analysis detailing your home's value as well as a comparison with similar homes in the area
Home Values in the Area
Average Home Value in this Area
Purchase History
| Date | Type | Sale Price | Title Company |
|---|---|---|---|
| Deed | $840,000 | None Available | |
| Deed | $840,000 | None Available | |
| Not Resolvable | $489,900 | -- | |
| Not Resolvable | $489,900 | -- | |
| Deed | -- | -- | |
| Deed | -- | -- |
Source: Public Records
Mortgage History
| Date | Status | Loan Amount | Loan Type |
|---|---|---|---|
| Open | $672,000 | Purchase Money Mortgage | |
| Closed | $672,000 | Purchase Money Mortgage | |
| Previous Owner | $575,000 | Stand Alone Refi Refinance Of Original Loan | |
| Previous Owner | $250,000 | Credit Line Revolving | |
| Previous Owner | $100,000 | Balloon |
Source: Public Records
Property History
| Date | Event | Price | Change | Sq Ft Price |
|---|---|---|---|---|
| 05/07/2025 05/07/25 | Sold | $840,000 | +1.2% | $310 / Sq Ft |
| 03/07/2025 03/07/25 | Pending | -- | -- | -- |
| 02/25/2025 02/25/25 | For Sale | $830,000 | +69.4% | $306 / Sq Ft |
| 10/10/2014 10/10/14 | Sold | $489,900 | -2.0% | $196 / Sq Ft |
| 09/04/2014 09/04/14 | Pending | -- | -- | -- |
| 08/21/2014 08/21/14 | Price Changed | $499,900 | -2.0% | $200 / Sq Ft |
| 07/29/2014 07/29/14 | For Sale | $509,900 | -- | $204 / Sq Ft |
Source: MLS Property Information Network (MLS PIN)
Tax History Compared to Growth
Tax History
| Year | Tax Paid | Tax Assessment Tax Assessment Total Assessment is a certain percentage of the fair market value that is determined by local assessors to be the total taxable value of land and additions on the property. | Land | Improvement |
|---|---|---|---|---|
| 2025 | $7,476 | $740,200 | $220,600 | $519,600 |
| 2024 | $7,304 | $711,200 | $210,100 | $501,100 |
| 2023 | $6,886 | $658,900 | $194,600 | $464,300 |
| 2022 | $6,717 | $586,100 | $180,200 | $405,900 |
| 2021 | $6,512 | $554,700 | $180,200 | $374,500 |
| 2020 | $6,397 | $536,700 | $180,200 | $356,500 |
| 2019 | $6,238 | $514,700 | $173,300 | $341,400 |
| 2018 | $6,020 | $481,600 | $165,000 | $316,600 |
| 2017 | $5,922 | $462,300 | $157,200 | $305,100 |
| 2016 | $5,691 | $444,600 | $151,100 | $293,500 |
| 2015 | $4,395 | $340,700 | $151,100 | $189,600 |
| 2014 | $4,281 | $321,900 | $140,600 | $181,300 |
Source: Public Records
Agents Affiliated with this Home
-
H
Seller's Agent in 2025
Heather Roy
William Raveis R.E. & Home Services
1 in this area
15 Total Sales
-
C
Buyer's Agent in 2025
Chris Remmes Group
Remmes & Co.
1 in this area
53 Total Sales
-
Seller's Agent in 2014
Dan DiRenzo
Realty Choice, Inc.
(781) 424-5318
40 Total Sales
Map
Source: MLS Property Information Network (MLS PIN)
MLS Number: 71720929
APN: WEYM-000027-000357-000051
Disclaimer: Certain information contained herein is derived from information provided by parties other than Homes.com. All information provided is deemed reliable, but is not guaranteed to be accurate and should be independently verified.
![]() The property listing data and information, or the Images, set forth herein were provided to MLS Property Information Network, Inc. from third party sources, including sellers, lessors and public records, and were compiled by MLS Property Information Network, Inc. The property listing data and information, and the Images, are for the personal, non-commercial use of consumers having a good faith interest in purchasing or leasing listed properties of the type displayed to them and may not be used for any purpose other than to identify prospective properties which such consumers may have a good faith interest in purchasing or leasing. MLS Property Information Network, Inc. and its subscribers disclaim any and all representations and warranties as to the accuracy of the property listing data and information, or as to the accuracy of any of the Images, set forth herein.
The property listing data and information, or the Images, set forth herein were provided to MLS Property Information Network, Inc. from third party sources, including sellers, lessors and public records, and were compiled by MLS Property Information Network, Inc. The property listing data and information, and the Images, are for the personal, non-commercial use of consumers having a good faith interest in purchasing or leasing listed properties of the type displayed to them and may not be used for any purpose other than to identify prospective properties which such consumers may have a good faith interest in purchasing or leasing. MLS Property Information Network, Inc. and its subscribers disclaim any and all representations and warranties as to the accuracy of the property listing data and information, or as to the accuracy of any of the Images, set forth herein.
Nearby Homes
- 47 Alewife Ln
- 8 Lorraine St
- 86 Black Rock Dr
- 37 Raleigh Rd
- 914 Pleasant St
- 34-36 Washburn St
- 16 Oak Cliff Rd
- 52 High St
- 163 Lake St
- 17 Woodbine Rd
- 71 Clubhouse Dr
- 986 Washington St Unit 8
- 994 Washington St Unit 2
- 49 Whitman St
- 14 Mutton Ln
- 49 Lake View Rd
- 77 Lake Shore Dr
- 575 Broad St Unit 215
- 925 Washington St
- 36-38 Madison St