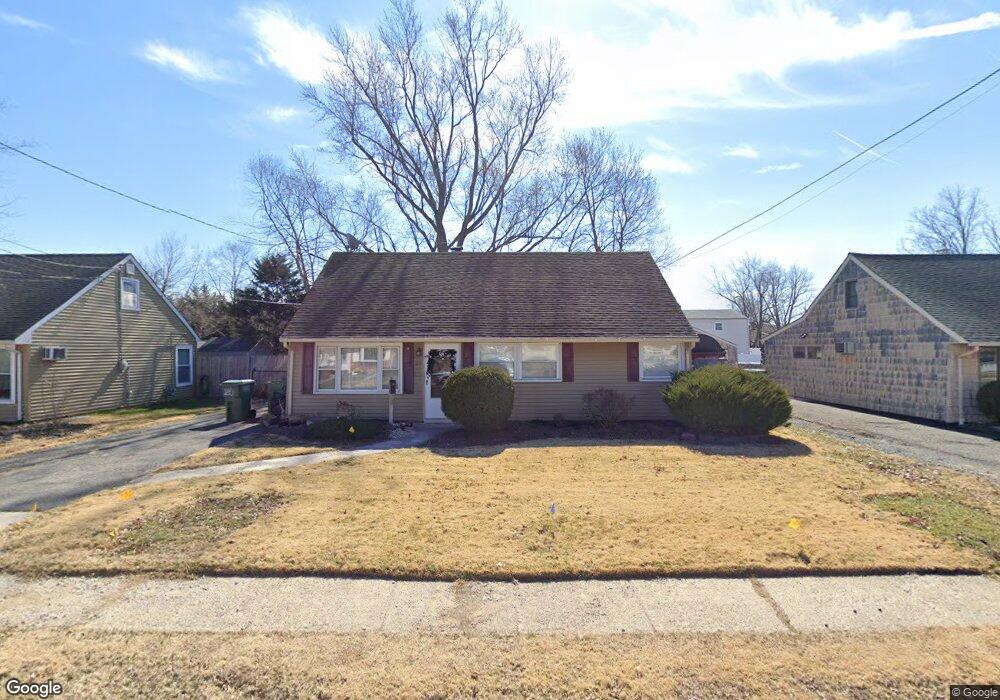
20 Mercury Rd Edison, NJ 08817
Estimated Value: $435,412 - $528,000
3
Beds
1
Bath
1,044
Sq Ft
$472/Sq Ft
Est. Value
About This Home
This home is located at 20 Mercury Rd, Edison, NJ 08817 and is currently estimated at $493,103, approximately $472 per square foot. 20 Mercury Rd is a home located in Middlesex County with nearby schools including Lincoln Elementary School, Herbert Hoover Middle School, and Edison High School.
Ownership History
Date
Name
Owned For
Owner Type
Purchase Details
Closed on
Jul 22, 2004
Sold by
Barnes Ken
Bought by
Lee Eun Jung
Current Estimated Value
Home Financials for this Owner
Home Financials are based on the most recent Mortgage that was taken out on this home.
Original Mortgage
$234,000
Outstanding Balance
$115,446
Interest Rate
6.03%
Estimated Equity
$377,658
Purchase Details
Closed on
Aug 14, 2001
Sold by
Walsh Thomas
Bought by
Barnes Ken and Barnes Stacy
Home Financials for this Owner
Home Financials are based on the most recent Mortgage that was taken out on this home.
Original Mortgage
$167,373
Interest Rate
7.04%
Mortgage Type
FHA
Purchase Details
Closed on
Aug 13, 1999
Sold by
Rooney Thomas
Bought by
Walsh Thomas
Home Financials for this Owner
Home Financials are based on the most recent Mortgage that was taken out on this home.
Original Mortgage
$108,412
Interest Rate
7.65%
Create a Home Valuation Report for This Property
The Home Valuation Report is an in-depth analysis detailing your home's value as well as a comparison with similar homes in the area
Home Values in the Area
Average Home Value in this Area
Purchase History
| Date | Buyer | Sale Price | Title Company |
|---|---|---|---|
| Lee Eun Jung | $260,000 | -- | |
| Barnes Ken | $170,000 | -- | |
| Walsh Thomas | $123,900 | -- |
Source: Public Records
Mortgage History
| Date | Status | Borrower | Loan Amount |
|---|---|---|---|
| Open | Lee Eun Jung | $234,000 | |
| Previous Owner | Barnes Ken | $167,373 | |
| Previous Owner | Walsh Thomas | $108,412 |
Source: Public Records
Tax History
| Year | Tax Paid | Tax Assessment Tax Assessment Total Assessment is a certain percentage of the fair market value that is determined by local assessors to be the total taxable value of land and additions on the property. | Land | Improvement |
|---|---|---|---|---|
| 2025 | $7,066 | $118,700 | $76,400 | $42,300 |
| 2024 | $7,028 | $118,700 | $76,400 | $42,300 |
| 2023 | $7,028 | $118,700 | $76,400 | $42,300 |
| 2022 | $7,031 | $118,700 | $76,400 | $42,300 |
| 2021 | $7,007 | $118,700 | $76,400 | $42,300 |
| 2020 | $6,943 | $118,700 | $76,400 | $42,300 |
| 2019 | $6,680 | $118,700 | $76,400 | $42,300 |
| 2018 | $6,519 | $118,700 | $76,400 | $42,300 |
| 2017 | $6,381 | $118,700 | $76,400 | $42,300 |
| 2016 | $6,263 | $118,700 | $76,400 | $42,300 |
| 2015 | $6,023 | $118,700 | $76,400 | $42,300 |
| 2014 | $5,847 | $118,700 | $76,400 | $42,300 |
Source: Public Records
Map
Nearby Homes
Your Personal Tour Guide
Ask me questions while you tour the home.