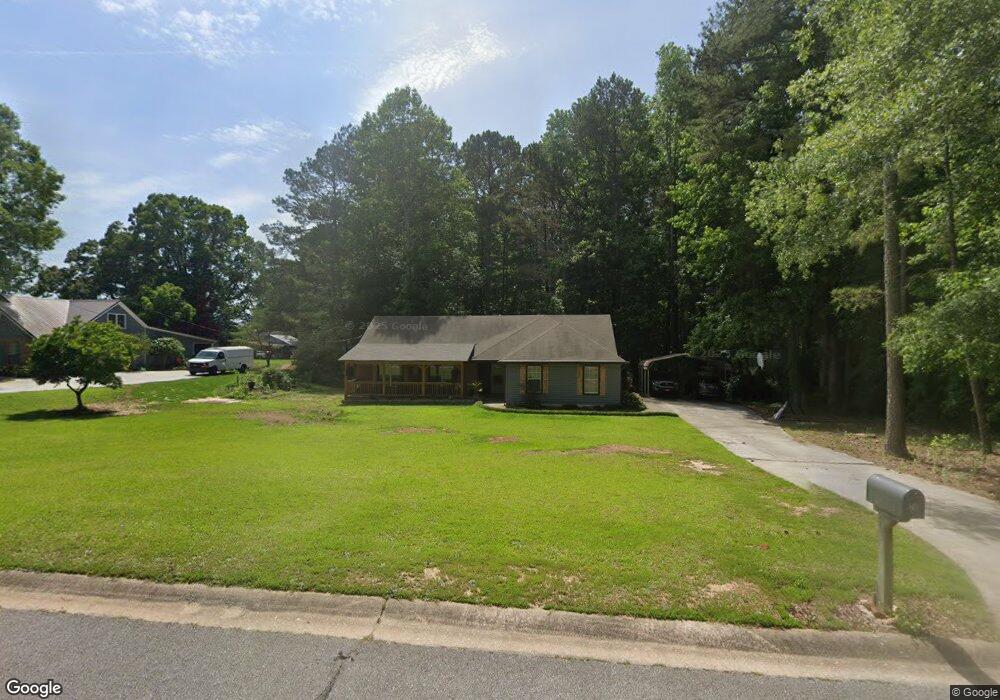
20 Meredith Trace Sharpsburg, GA 30277
Estimated Value: $232,143 - $287,000
3
Beds
2
Baths
1,095
Sq Ft
$240/Sq Ft
Est. Value
About This Home
This home is located at 20 Meredith Trace, Sharpsburg, GA 30277 and is currently estimated at $262,786, approximately $239 per square foot. 20 Meredith Trace is a home located in Coweta County with nearby schools including Poplar Road Elementary School, East Coweta Middle School, and East Coweta High School.
Ownership History
Date
Name
Owned For
Owner Type
Purchase Details
Closed on
May 28, 2002
Sold by
Sharpe Ste4ven R
Bought by
Gause Timmothy B
Current Estimated Value
Home Financials for this Owner
Home Financials are based on the most recent Mortgage that was taken out on this home.
Original Mortgage
$110,761
Outstanding Balance
$46,276
Interest Rate
6.92%
Mortgage Type
FHA
Estimated Equity
$216,510
Purchase Details
Closed on
Mar 31, 2000
Sold by
Sharpe Steven R and Sharpe Me
Bought by
Sharpe Steven R
Home Financials for this Owner
Home Financials are based on the most recent Mortgage that was taken out on this home.
Original Mortgage
$84,663
Interest Rate
8.29%
Mortgage Type
New Conventional
Purchase Details
Closed on
Jun 28, 1991
Bought by
Sharpe Steven R and Sharpe Me
Purchase Details
Closed on
Nov 15, 1990
Bought by
Premium Builders Inc
Purchase Details
Closed on
Jul 24, 1989
Bought by
Regional Atlanta Dev
Create a Home Valuation Report for This Property
The Home Valuation Report is an in-depth analysis detailing your home's value as well as a comparison with similar homes in the area
Home Values in the Area
Average Home Value in this Area
Purchase History
| Date | Buyer | Sale Price | Title Company |
|---|---|---|---|
| Gause Timmothy B | $112,500 | -- | |
| Sharpe Steven R | -- | -- | |
| Sharpe Steven R | $70,500 | -- | |
| Premium Builders Inc | $91,000 | -- | |
| Regional Atlanta Dev | -- | -- |
Source: Public Records
Mortgage History
| Date | Status | Borrower | Loan Amount |
|---|---|---|---|
| Open | Gause Timmothy B | $110,761 | |
| Previous Owner | Sharpe Steven R | $84,663 |
Source: Public Records
Tax History Compared to Growth
Tax History
| Year | Tax Paid | Tax Assessment Tax Assessment Total Assessment is a certain percentage of the fair market value that is determined by local assessors to be the total taxable value of land and additions on the property. | Land | Improvement |
|---|---|---|---|---|
| 2025 | $1,718 | $75,519 | $20,000 | $55,519 |
| 2024 | $1,724 | $76,775 | $20,000 | $56,775 |
| 2023 | $1,724 | $74,358 | $20,000 | $54,358 |
| 2022 | $1,676 | $70,790 | $20,000 | $50,790 |
| 2021 | $1,460 | $58,298 | $14,000 | $44,298 |
| 2020 | $1,245 | $49,877 | $14,000 | $35,877 |
| 2019 | $1,231 | $45,212 | $10,000 | $35,212 |
| 2018 | $1,234 | $45,212 | $10,000 | $35,212 |
| 2017 | $1,233 | $45,212 | $10,000 | $35,212 |
| 2016 | $1,221 | $45,212 | $10,000 | $35,212 |
| 2015 | $1,043 | $39,578 | $10,000 | $29,578 |
| 2014 | $855 | $39,578 | $10,000 | $29,578 |
Source: Public Records
Map
Nearby Homes
- 140 Halo Trace
- 68 Winchester Dr
- 46 Lullwater Ct
- 138 Main St
- 565 Timberbrook Dr
- 1 Mcintosh Trail
- 0 Highway 154 Unit 10470800
- 0 Bob Smith Rd Unit 10562838
- 196 Bob Smith Rd
- 250 Bob Smith Rd
- 316 Winchester Dr
- 180 Saint James Place
- 270 Sturgess Run
- 25 Chemin Place
- 65 Oakhurst Trail
- 69 Oakhurst Trail
- 25 Lentry Dr
- 49 Durham Estates Dr
- 20 Beaver Creek Ln
- 296 Mcintosh Trail
- 10 Meredith Trace
- 30 Meredith Trace
- 30 Merideth Trace
- 25 Meredith Trace
- 4 Meredith Trace
- 40 Meredith Trace
- 5 Meredith Trace
- 35 Meredith Trace Unit 3
- 35 Meredith Trace
- 45 Lindsey Ln
- 35 Lindsey Ln
- 45 Meredith Trace
- 55 Lindsey Ln
- 25 Lindsey Ln
- 50 Meredith Trace
- 15 Lindsey Ln
- 65 Lindsey Ln
- 290 Old Highway 16
- 300 Old Highway 16
- 276 Old Highway 16