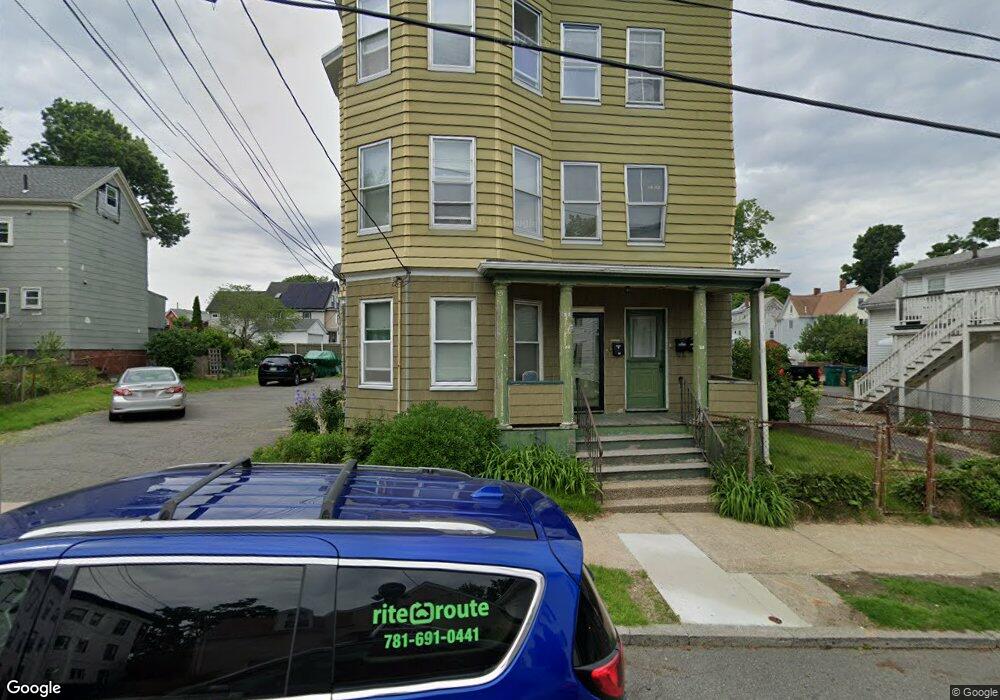
20 Michigan Ave Unit 22 Lynn, MA 01902
Diamond District NeighborhoodEstimated Value: $741,509 - $1,218,000
6
Beds
3
Baths
3,813
Sq Ft
$251/Sq Ft
Est. Value
About This Home
This home is located at 20 Michigan Ave Unit 22, Lynn, MA 01902 and is currently estimated at $958,127, approximately $251 per square foot. 20 Michigan Ave Unit 22 is a home located in Essex County with nearby schools including Brickett Elementary School, William R. Fallon School, and Marshall Middle School.
Ownership History
Date
Name
Owned For
Owner Type
Purchase Details
Closed on
Nov 16, 1999
Sold by
Perullo Ft and Perullo
Bought by
Ogbebor Bokun Adena
Current Estimated Value
Home Financials for this Owner
Home Financials are based on the most recent Mortgage that was taken out on this home.
Original Mortgage
$212,500
Outstanding Balance
$62,322
Interest Rate
7.68%
Mortgage Type
Purchase Money Mortgage
Estimated Equity
$895,805
Purchase Details
Closed on
Sep 28, 1993
Sold by
Darcangelo Ronald M and Darcangelo Mary T
Bought by
Gates Michelle M
Home Financials for this Owner
Home Financials are based on the most recent Mortgage that was taken out on this home.
Original Mortgage
$143,650
Interest Rate
7.1%
Mortgage Type
Purchase Money Mortgage
Create a Home Valuation Report for This Property
The Home Valuation Report is an in-depth analysis detailing your home's value as well as a comparison with similar homes in the area
Home Values in the Area
Average Home Value in this Area
Purchase History
| Date | Buyer | Sale Price | Title Company |
|---|---|---|---|
| Ogbebor Bokun Adena | $212,500 | -- | |
| Ogbebor Bokun Adena | $212,500 | -- | |
| Gates Michelle M | $150,000 | -- | |
| Gates Michelle M | $150,000 | -- |
Source: Public Records
Mortgage History
| Date | Status | Borrower | Loan Amount |
|---|---|---|---|
| Open | Ogbebor Bokun Adena | $212,500 | |
| Closed | Gates Michelle M | $212,500 | |
| Previous Owner | Gates Michelle M | $143,650 | |
| Previous Owner | Gates Michelle M | $50,000 |
Source: Public Records
Tax History Compared to Growth
Tax History
| Year | Tax Paid | Tax Assessment Tax Assessment Total Assessment is a certain percentage of the fair market value that is determined by local assessors to be the total taxable value of land and additions on the property. | Land | Improvement |
|---|---|---|---|---|
| 2025 | $8,581 | $828,300 | $234,600 | $593,700 |
| 2024 | $8,511 | $808,300 | $220,600 | $587,700 |
| 2023 | $8,279 | $742,500 | $217,600 | $524,900 |
| 2022 | $8,021 | $645,300 | $175,100 | $470,200 |
| 2021 | $7,510 | $576,400 | $148,100 | $428,300 |
| 2020 | $7,216 | $538,500 | $144,600 | $393,900 |
| 2019 | $7,034 | $491,900 | $135,100 | $356,800 |
| 2018 | $6,798 | $448,700 | $145,600 | $303,100 |
| 2017 | $6,290 | $403,200 | $120,100 | $283,100 |
| 2016 | $6,045 | $373,600 | $120,600 | $253,000 |
| 2015 | $5,646 | $337,100 | $120,600 | $216,500 |
Source: Public Records
Map
Nearby Homes
- 46 Wardwell Ave
- 2 Peirce Rd
- 7-9 Rock Ave
- 133 Eastern Ave Unit 8
- 42 Basset St
- 28 Claremont Terrace Unit 4
- 28 Claremont Terrace Unit 6
- 108-110 Burrill St Unit 1
- 35 Columbia Ave
- 26 Groveland St
- 30 Paradise Rd
- 38 Cherry St Unit 1
- 24 Parrott St
- 189 Burrill St Unit 2
- 29-31 Essex Ave Unit 2
- 129 Williams Ave
- 59 Essex St Unit 59B
- 80 Norfolk Ave Unit 1
- 175 Essex St
- 38 Chestnut St
- 28 Michigan Ave
- 16 Michigan Ave
- 14 Wardwell Place
- 12 Michigan Ave Unit 14
- 12 Michigan Ave Unit 12 Michigan Ave Lynn
- 14 Michigan Ave Unit 14 Michigan Ave Lynn
- 12-14-14 Michigan Ave
- 12-14-14 Michigan Ave Unit 1
- 12 Michigan Ave Unit 3
- 12 Michigan Ave Unit 2
- 21R Michigan Ave
- 21 Michigan Ave
- 18 Ocean Cir
- 10 Wardwell Place
- 9 Wardwell Place
- 33 Wardwell Ave
- 25 Michigan Ave
- 10 Michigan Ave
- 29 Michigan Ave
- 19 Michigan Ave