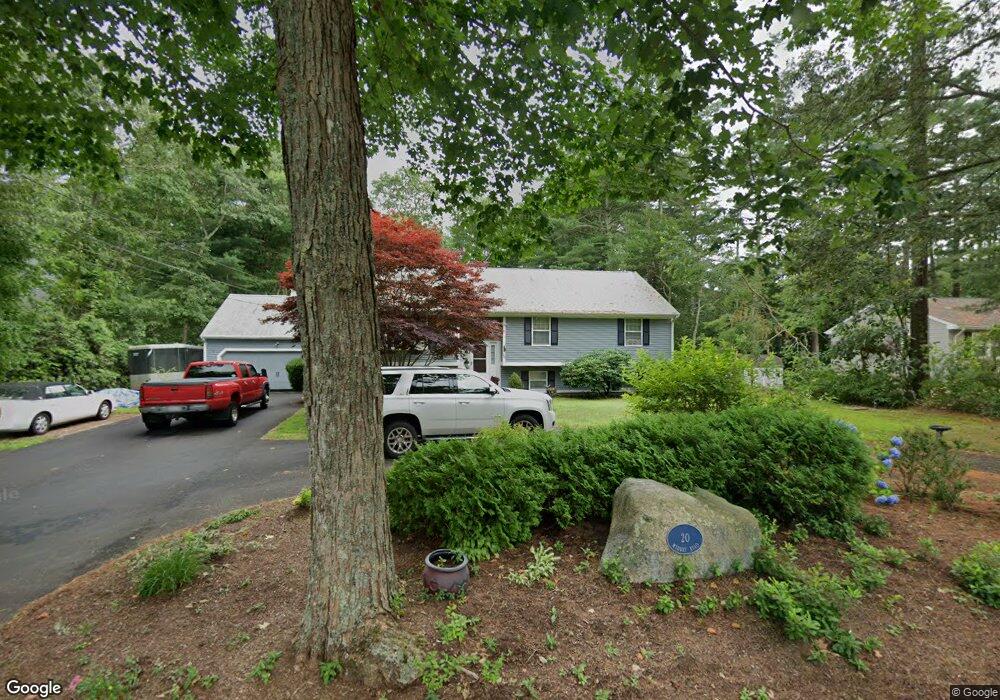
20 Midway Rd Pocasset, MA 02559
Monument Beach NeighborhoodEstimated Value: $753,000 - $832,000
3
Beds
3
Baths
2,848
Sq Ft
$279/Sq Ft
Est. Value
About This Home
This home is located at 20 Midway Rd, Pocasset, MA 02559 and is currently estimated at $793,705, approximately $278 per square foot. 20 Midway Rd is a home located in Barnstable County with nearby schools including Bourne High School, Cadence Academy Preschool - Bourne, and St Margaret Regional School.
Ownership History
Date
Name
Owned For
Owner Type
Purchase Details
Closed on
Oct 29, 2008
Sold by
Macdonald Mary and Macdonald William
Bought by
Robinson James A and Robinson Suzanne N
Current Estimated Value
Purchase Details
Closed on
Jun 30, 2005
Sold by
Cook Laura A
Bought by
Macdonald Mary and Macdonald William
Purchase Details
Closed on
Jan 12, 1994
Sold by
Shea Walter J and Shea Frederika R
Bought by
Cook Laura A
Create a Home Valuation Report for This Property
The Home Valuation Report is an in-depth analysis detailing your home's value as well as a comparison with similar homes in the area
Home Values in the Area
Average Home Value in this Area
Purchase History
| Date | Buyer | Sale Price | Title Company |
|---|---|---|---|
| Robinson James A | $352,000 | -- | |
| Robinson James A | $352,000 | -- | |
| Macdonald Mary | $438,000 | -- | |
| Macdonald Mary | $438,000 | -- | |
| Cook Laura A | $181,500 | -- | |
| Cook Laura A | $181,500 | -- |
Source: Public Records
Mortgage History
| Date | Status | Borrower | Loan Amount |
|---|---|---|---|
| Open | Cook Laura A | $211,000 | |
| Closed | Cook Laura A | $20,000 |
Source: Public Records
Tax History Compared to Growth
Tax History
| Year | Tax Paid | Tax Assessment Tax Assessment Total Assessment is a certain percentage of the fair market value that is determined by local assessors to be the total taxable value of land and additions on the property. | Land | Improvement |
|---|---|---|---|---|
| 2025 | $4,935 | $631,900 | $223,100 | $408,800 |
| 2024 | $4,826 | $601,800 | $212,500 | $389,300 |
| 2023 | $4,692 | $532,600 | $188,000 | $344,600 |
| 2022 | $4,439 | $439,900 | $166,400 | $273,500 |
| 2021 | $4,310 | $400,200 | $151,400 | $248,800 |
| 2020 | $4,225 | $393,400 | $150,000 | $243,400 |
| 2019 | $3,991 | $379,700 | $150,000 | $229,700 |
| 2018 | $3,919 | $371,800 | $142,900 | $228,900 |
| 2017 | $3,599 | $349,400 | $134,500 | $214,900 |
| 2016 | $3,502 | $344,700 | $134,500 | $210,200 |
| 2015 | $3,328 | $330,500 | $120,300 | $210,200 |
Source: Public Records
Map
Nearby Homes
- 501 County Rd
- 515 County Rd
- 566 Shore Rd
- 18 Douglas Ave
- 30 Howard Ave
- 39 Bennets Neck Dr
- 93 Valley Bars Rd
- 105 Clay Pond Rd
- 18 Carlton Rd
- 14 Navajo Rd
- 709 County Rd
- 174 Barlows Landing Rd
- 254 Barlows Landing Rd
- 940 County Rd
- 12 Beachwood Rd
- 2 Westerly Dr
- 15 1st St
- 41 Portside Dr
- 7 Portside Dr
- 7 4th Ave