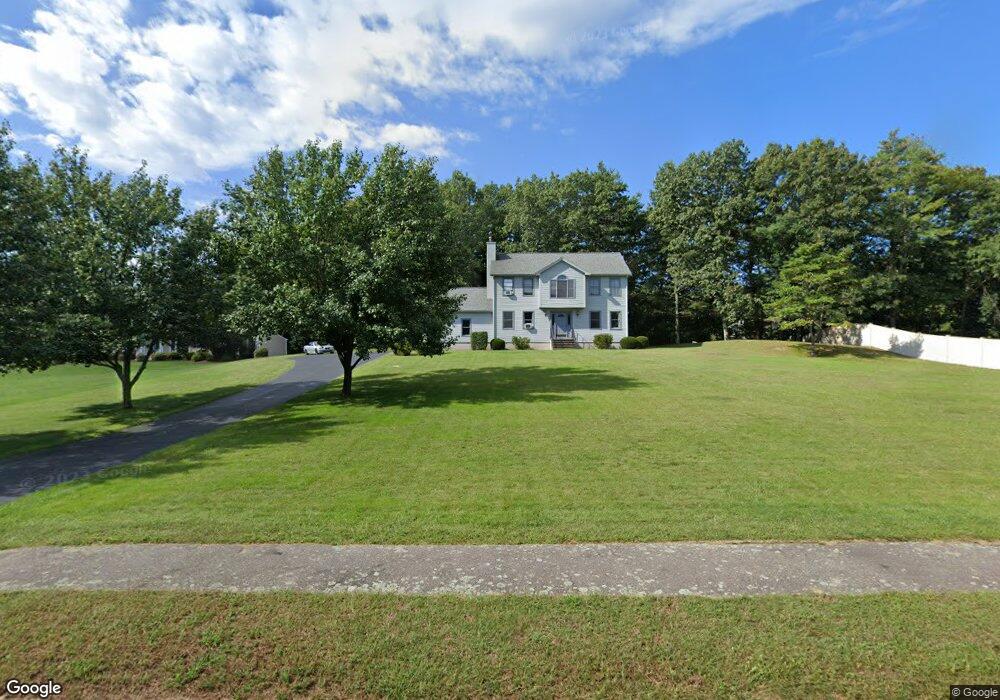
20 Mill Pond Dr Wrentham, MA 02093
Estimated Value: $713,000 - $1,096,000
4
Beds
3
Baths
1,947
Sq Ft
$430/Sq Ft
Est. Value
About This Home
This home is located at 20 Mill Pond Dr, Wrentham, MA 02093 and is currently estimated at $837,808, approximately $430 per square foot. 20 Mill Pond Dr is a home located in Norfolk County with nearby schools including Delaney Elementary School, Charles E Roderick, and Mercymount Country Day School.
Ownership History
Date
Name
Owned For
Owner Type
Purchase Details
Closed on
Oct 23, 1992
Sold by
Dunster Homes Inc
Bought by
Davis Frederick A and Davis Carol A
Current Estimated Value
Home Financials for this Owner
Home Financials are based on the most recent Mortgage that was taken out on this home.
Original Mortgage
$120,000
Interest Rate
7.79%
Mortgage Type
Purchase Money Mortgage
Create a Home Valuation Report for This Property
The Home Valuation Report is an in-depth analysis detailing your home's value as well as a comparison with similar homes in the area
Purchase History
| Date | Buyer | Sale Price | Title Company |
|---|---|---|---|
| Davis Frederick A | $190,000 | -- |
Source: Public Records
Mortgage History
| Date | Status | Borrower | Loan Amount |
|---|---|---|---|
| Open | Davis Frederick A | $170,000 | |
| Closed | Davis Frederick A | $130,000 | |
| Closed | Davis Frederick A | $10,000 | |
| Closed | Davis Frederick A | $120,000 |
Source: Public Records
Tax History
| Year | Tax Paid | Tax Assessment Tax Assessment Total Assessment is a certain percentage of the fair market value that is determined by local assessors to be the total taxable value of land and additions on the property. | Land | Improvement |
|---|---|---|---|---|
| 2025 | $7,896 | $681,300 | $302,700 | $378,600 |
| 2024 | $7,663 | $638,600 | $302,700 | $335,900 |
| 2023 | $7,451 | $590,400 | $275,100 | $315,300 |
| 2022 | $7,148 | $522,900 | $256,600 | $266,300 |
| 2021 | $6,602 | $469,200 | $224,000 | $245,200 |
| 2020 | $6,532 | $458,400 | $199,200 | $259,200 |
| 2019 | $6,307 | $446,700 | $199,200 | $247,500 |
| 2018 | $6,183 | $434,200 | $199,400 | $234,800 |
| 2017 | $6,062 | $425,400 | $195,600 | $229,800 |
| 2016 | $5,930 | $415,300 | $189,900 | $225,400 |
| 2015 | $5,920 | $395,200 | $182,600 | $212,600 |
| 2014 | $5,861 | $382,800 | $175,600 | $207,200 |
Source: Public Records
Map
Nearby Homes
- 10 Earle Stewart Ln Unit Lot 5
- 12 Earle Stewart Ln
- 3 Earle Stewart Ln
- 2 Earle Stewart Ln
- 1222 South St
- 613 West St
- 135 Creek St Unit 2
- 440 Chestnut St
- 0 Berry St
- 18 Huntington Ave
- 10 Nature View Dr
- 15 Nature View Dr
- 19 Chestnut Lot 0
- 955 Summer St
- 20 Field Cir
- 500 Franklin St
- 11 Amber Dr
- 160 Washington St Unit 22
- 0 Fall Ln
- 158 Washington St
Your Personal Tour Guide
Ask me questions while you tour the home.