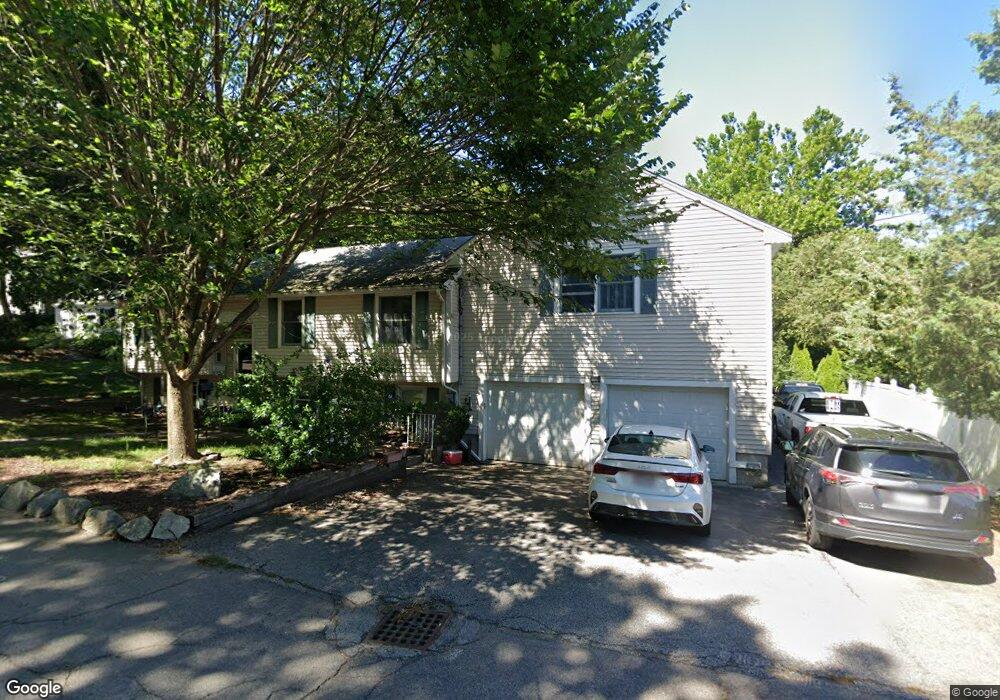
20 Moore Rd East Weymouth, MA 02189
East Weymouth NeighborhoodEstimated Value: $592,000 - $809,000
3
Beds
3
Baths
2,088
Sq Ft
$349/Sq Ft
Est. Value
About This Home
This home is located at 20 Moore Rd, East Weymouth, MA 02189 and is currently estimated at $729,485, approximately $349 per square foot. 20 Moore Rd is a home located in Norfolk County with nearby schools including Ralph Talbot Primary School, Abigail Adams Middle School, and Weymouth Middle School Chapman.
Ownership History
Date
Name
Owned For
Owner Type
Purchase Details
Closed on
Jul 19, 2013
Sold by
Rocci Richard A
Bought by
Rocci Richard A and Rocci Andrea F
Current Estimated Value
Purchase Details
Closed on
Aug 31, 2011
Sold by
Rocci Richard A and Rocci Andrea J
Bought by
Rocci Richard A
Home Financials for this Owner
Home Financials are based on the most recent Mortgage that was taken out on this home.
Original Mortgage
$80,000
Interest Rate
3%
Mortgage Type
Purchase Money Mortgage
Create a Home Valuation Report for This Property
The Home Valuation Report is an in-depth analysis detailing your home's value as well as a comparison with similar homes in the area
Home Values in the Area
Average Home Value in this Area
Purchase History
| Date | Buyer | Sale Price | Title Company |
|---|---|---|---|
| Rocci Richard A | -- | -- | |
| Rocci Richard A | -- | -- |
Source: Public Records
Mortgage History
| Date | Status | Borrower | Loan Amount |
|---|---|---|---|
| Previous Owner | Rocci Richard A | $80,000 |
Source: Public Records
Tax History Compared to Growth
Tax History
| Year | Tax Paid | Tax Assessment Tax Assessment Total Assessment is a certain percentage of the fair market value that is determined by local assessors to be the total taxable value of land and additions on the property. | Land | Improvement |
|---|---|---|---|---|
| 2025 | $7,752 | $767,500 | $222,300 | $545,200 |
| 2024 | $7,581 | $738,200 | $211,800 | $526,400 |
| 2023 | $7,148 | $684,000 | $196,100 | $487,900 |
| 2022 | $6,973 | $608,500 | $181,600 | $426,900 |
| 2021 | $6,495 | $553,200 | $181,600 | $371,600 |
| 2020 | $6,380 | $535,200 | $181,600 | $353,600 |
| 2019 | $6,272 | $517,500 | $174,600 | $342,900 |
| 2018 | $6,054 | $484,300 | $166,300 | $318,000 |
| 2017 | $5,962 | $465,400 | $158,400 | $307,000 |
| 2016 | $5,777 | $451,300 | $152,300 | $299,000 |
| 2015 | $4,781 | $370,600 | $152,300 | $218,300 |
| 2014 | $4,668 | $351,000 | $141,700 | $209,300 |
Source: Public Records
Map
Nearby Homes
- 675 Pleasant St Unit 8
- 131 Mutton Ln
- 14 Old Stone Way Unit 11
- 1015 Washington St
- 10 Chapman St Unit 202
- 955 Pleasant St Unit 11
- 16 Oak Cliff Rd
- 966 Washington St Unit 2
- 25 Echo Ave
- 191 Tall Oaks Dr Unit C
- 200 Burkhall St Unit 102
- 86 Black Rock Dr
- 110 Burkhall St Unit H
- 120 Burkhall St Unit K
- 279 Pine St
- 376 Pleasant St
- 747 Middle St
- 211 Lake Shore Dr
- 341 Ralph Talbot St
- 215 Winter St Unit 1P
- 703 Pleasant St
- 711 Pleasant St Unit 713
- 719 Pleasant St
- 693 Pleasant St
- 725 Pleasant St
- 720 Pleasant St
- 731 Pleasant St
- 731 Pleasant St Unit 731
- 714 Pleasant St
- 706 Pleasant St
- 692 Pleasant St
- 735 Pleasant St
- 726 Pleasant St
- 688 Pleasant St
- 83 Woodrock Rd
- 739 Pleasant St
- 734 Pleasant St
- 675 Pleasant St Unit 7
- 675 Pleasant St Unit 6
- 675 Pleasant St Unit 5