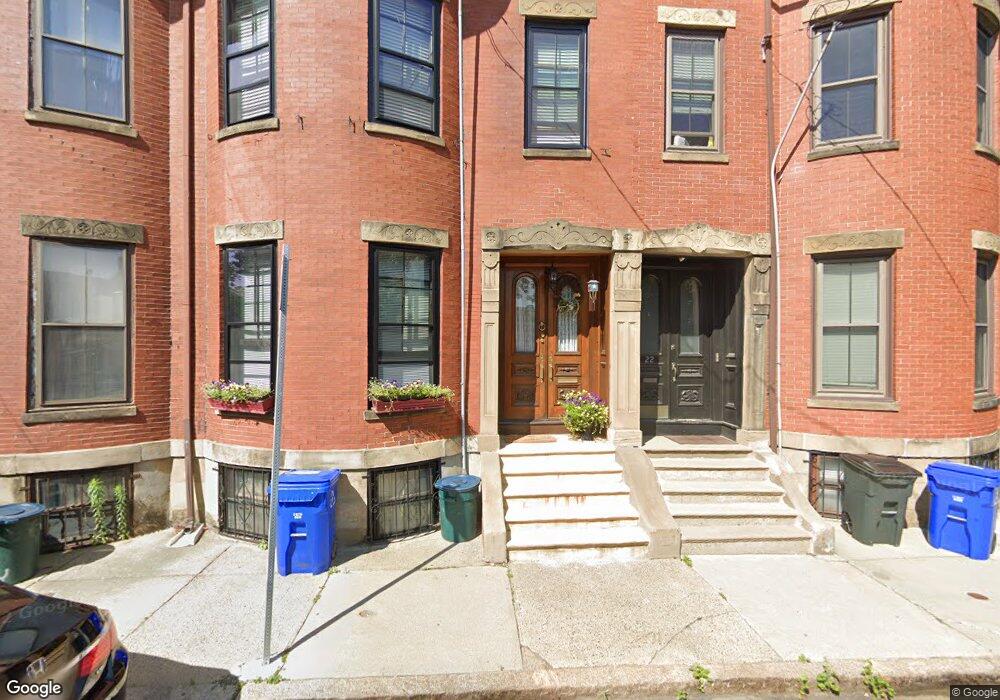
20 Morley St Roxbury, MA 02119
Fort Hill NeighborhoodEstimated Value: $921,175 - $1,174,000
3
Beds
2
Baths
2,568
Sq Ft
$397/Sq Ft
Est. Value
About This Home
This home is located at 20 Morley St, Roxbury, MA 02119 and is currently estimated at $1,020,294, approximately $397 per square foot. 20 Morley St is a home located in Suffolk County with nearby schools including City on a Hill Charter Public School, Paige Academy, and Malik Academy.
Ownership History
Date
Name
Owned For
Owner Type
Purchase Details
Closed on
Dec 31, 1996
Sold by
Moore Earl D and Oci Mtg Corp
Bought by
Lezama Anthony
Current Estimated Value
Home Financials for this Owner
Home Financials are based on the most recent Mortgage that was taken out on this home.
Original Mortgage
$65,500
Interest Rate
7.55%
Mortgage Type
Purchase Money Mortgage
Create a Home Valuation Report for This Property
The Home Valuation Report is an in-depth analysis detailing your home's value as well as a comparison with similar homes in the area
Home Values in the Area
Average Home Value in this Area
Purchase History
| Date | Buyer | Sale Price | Title Company |
|---|---|---|---|
| Lezama Anthony | $65,500 | -- |
Source: Public Records
Mortgage History
| Date | Status | Borrower | Loan Amount |
|---|---|---|---|
| Open | Lezama Anthony | $115,000 | |
| Closed | Lezama Anthony | $85,500 | |
| Closed | Lezama Anthony | $65,500 |
Source: Public Records
Tax History Compared to Growth
Tax History
| Year | Tax Paid | Tax Assessment Tax Assessment Total Assessment is a certain percentage of the fair market value that is determined by local assessors to be the total taxable value of land and additions on the property. | Land | Improvement |
|---|---|---|---|---|
| 2025 | $9,435 | $814,800 | $289,900 | $524,900 |
| 2024 | $9,136 | $838,200 | $174,700 | $663,500 |
| 2023 | $8,656 | $806,000 | $168,000 | $638,000 |
| 2022 | $7,972 | $732,700 | $152,700 | $580,000 |
| 2021 | $7,307 | $684,800 | $142,700 | $542,100 |
| 2020 | $6,137 | $581,200 | $135,600 | $445,600 |
| 2019 | $5,726 | $543,300 | $103,800 | $439,500 |
| 2018 | $5,275 | $503,300 | $103,800 | $399,500 |
| 2017 | $4,697 | $443,576 | $92,382 | $351,194 |
| 2016 | $4,030 | $366,408 | $87,192 | $279,216 |
| 2015 | $3,788 | $312,800 | $70,400 | $242,400 |
| 2014 | $3,576 | $284,300 | $70,400 | $213,900 |
Source: Public Records
Map
Nearby Homes
- 49 Norfolk St
- 10 Linwood St
- 249 Roxbury St Unit 1
- 31 Dorr St
- 27 Dudley St
- 59 Fort Ave
- 38 Juniper St
- 4 Fort Ave Unit 2
- 743 Parker St Unit 3
- 9 W Cedar St Unit 1
- 51 Saint James St
- 51 Beech Glen St Unit 3
- 63 Beech Glen St
- 37 Regent St Unit 2
- 6 Fisher Ave
- 10 Taber St Unit 501
- 22 Fisher Ave
- 9-45 Vale St
- 2149 Washington St Unit 604
- 2149 Washington St Unit 610
- 22 Morley St
- 18 Morley St
- 16 Morley St
- 14 Morley St
- 12 Morley St
- 17 Morley St
- 15 Morley St
- 11 Morley St
- 19 Morley St Unit 2
- 19 Morley St Unit 1
- 16 Centre St Unit 18R
- 22 Centre St
- 2 Eliot Terrace
- 26 Centre St
- 14 Centre St
- 25 Highland St
- Lot D Highland Ave
- 13 Highland Ave Unit 3
- 13 Highland Ave Unit 2
- 13 Highland Ave Unit 1