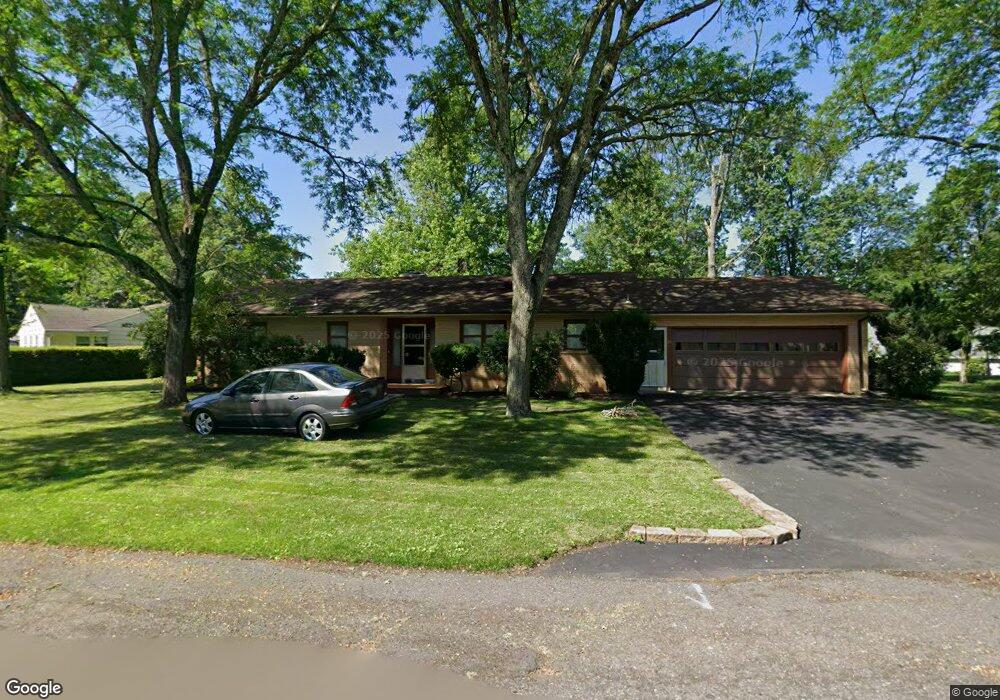
20 Muhlenberg Cir Quakertown, PA 18951
Estimated Value: $312,000 - $479,879
3
Beds
2
Baths
1,653
Sq Ft
$248/Sq Ft
Est. Value
About This Home
This home is located at 20 Muhlenberg Cir, Quakertown, PA 18951 and is currently estimated at $409,470, approximately $247 per square foot. 20 Muhlenberg Cir is a home located in Bucks County with nearby schools including Quakertown Elementary School, Strayer Middle School, and Quakertown Community Senior High School.
Ownership History
Date
Name
Owned For
Owner Type
Purchase Details
Closed on
Jan 6, 2003
Sold by
Landis Mark and Landis Scott
Bought by
Landis Scott
Current Estimated Value
Home Financials for this Owner
Home Financials are based on the most recent Mortgage that was taken out on this home.
Original Mortgage
$45,000
Outstanding Balance
$19,421
Interest Rate
6.18%
Estimated Equity
$390,049
Purchase Details
Closed on
Jul 17, 2002
Sold by
Mcgee Peter
Bought by
Landis Mark and Landis Scott
Create a Home Valuation Report for This Property
The Home Valuation Report is an in-depth analysis detailing your home's value as well as a comparison with similar homes in the area
Home Values in the Area
Average Home Value in this Area
Purchase History
| Date | Buyer | Sale Price | Title Company |
|---|---|---|---|
| Landis Scott | -- | -- | |
| Landis Mark | -- | -- |
Source: Public Records
Mortgage History
| Date | Status | Borrower | Loan Amount |
|---|---|---|---|
| Open | Landis Scott | $45,000 |
Source: Public Records
Tax History Compared to Growth
Tax History
| Year | Tax Paid | Tax Assessment Tax Assessment Total Assessment is a certain percentage of the fair market value that is determined by local assessors to be the total taxable value of land and additions on the property. | Land | Improvement |
|---|---|---|---|---|
| 2025 | $7,488 | $37,200 | $8,440 | $28,760 |
| 2024 | $7,488 | $37,200 | $8,440 | $28,760 |
| 2023 | $7,413 | $37,200 | $8,440 | $28,760 |
| 2022 | $7,288 | $37,200 | $8,440 | $28,760 |
| 2021 | $7,288 | $37,200 | $8,440 | $28,760 |
| 2020 | $7,288 | $37,200 | $8,440 | $28,760 |
| 2019 | $7,085 | $37,200 | $8,440 | $28,760 |
| 2018 | $6,839 | $37,200 | $8,440 | $28,760 |
| 2017 | $6,627 | $37,200 | $8,440 | $28,760 |
| 2016 | $6,627 | $37,200 | $8,440 | $28,760 |
| 2015 | -- | $37,200 | $8,440 | $28,760 |
| 2014 | -- | $37,200 | $8,440 | $28,760 |
Source: Public Records
Map
Nearby Homes