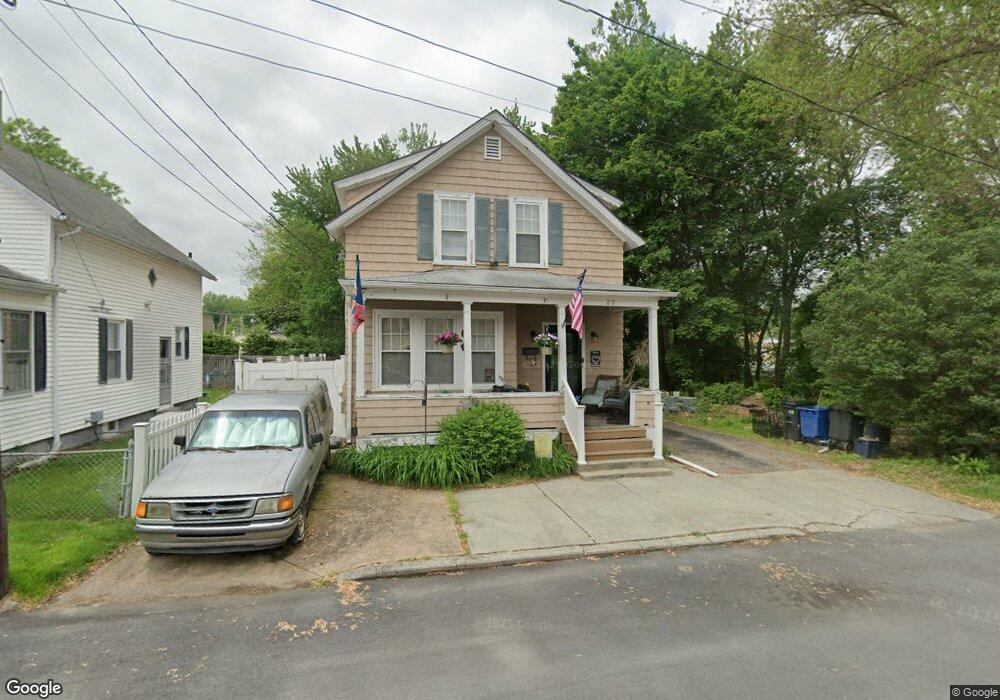
20 Myrtle Ave Johnston, RI 02919
Thornton NeighborhoodEstimated Value: $348,231 - $550,000
3
Beds
1
Bath
1,307
Sq Ft
$307/Sq Ft
Est. Value
About This Home
This home is located at 20 Myrtle Ave, Johnston, RI 02919 and is currently estimated at $401,308, approximately $307 per square foot. 20 Myrtle Ave is a home located in Providence County with nearby schools including Johnston Senior High School, St Rocco School, and St Mary Elementary School.
Ownership History
Date
Name
Owned For
Owner Type
Purchase Details
Closed on
Mar 12, 2008
Sold by
Mortgage Guaranty Ins
Bought by
Barata James M and Rubin Jenna-Lys
Current Estimated Value
Home Financials for this Owner
Home Financials are based on the most recent Mortgage that was taken out on this home.
Original Mortgage
$167,373
Interest Rate
5.72%
Purchase Details
Closed on
Feb 25, 2004
Sold by
Fortin Christine A
Bought by
Brazil Joseph R and Brazil Lisa M
Purchase Details
Closed on
Jul 1, 2003
Sold by
Fortin Clifford J
Bought by
Fortin Christine A
Purchase Details
Closed on
Jun 9, 2000
Sold by
Walbridge John R
Bought by
Fortin Clifford J
Purchase Details
Closed on
Jul 19, 1999
Sold by
Smith Wayne T and Smith Margaret J
Bought by
Ri Housing & Mtg Fin
Purchase Details
Closed on
Feb 1, 1993
Sold by
Apici John A and Apici Gena
Bought by
Smith Wayne F
Create a Home Valuation Report for This Property
The Home Valuation Report is an in-depth analysis detailing your home's value as well as a comparison with similar homes in the area
Home Values in the Area
Average Home Value in this Area
Purchase History
| Date | Buyer | Sale Price | Title Company |
|---|---|---|---|
| Barata James M | $170,000 | -- | |
| Mortgage Guaranty Ins | $247,323 | -- | |
| Brazil Joseph R | $170,000 | -- | |
| Fortin Christine A | $135,000 | -- | |
| Fortin Clifford J | $85,000 | -- | |
| Ri Housing & Mtg Fin | $75,513 | -- | |
| Mortgage Guaranty Ins | $247,323 | -- | |
| Brazil Joseph R | $170,000 | -- | |
| Fortin Christine A | $135,000 | -- | |
| Fortin Clifford J | $85,000 | -- | |
| Ri Housing & Mtg Fin | $75,513 | -- | |
| Smith Wayne F | $78,000 | -- |
Source: Public Records
Mortgage History
| Date | Status | Borrower | Loan Amount |
|---|---|---|---|
| Open | Smith Wayne F | $153,298 | |
| Closed | Smith Wayne F | $167,373 |
Source: Public Records
Tax History Compared to Growth
Tax History
| Year | Tax Paid | Tax Assessment Tax Assessment Total Assessment is a certain percentage of the fair market value that is determined by local assessors to be the total taxable value of land and additions on the property. | Land | Improvement |
|---|---|---|---|---|
| 2025 | $3,419 | $218,900 | $78,000 | $140,900 |
| 2024 | $3,349 | $218,900 | $78,000 | $140,900 |
| 2023 | $3,349 | $218,900 | $78,000 | $140,900 |
| 2022 | $3,037 | $130,700 | $57,800 | $72,900 |
| 2021 | $3,037 | $130,700 | $57,800 | $72,900 |
| 2018 | $2,702 | $98,300 | $43,000 | $55,300 |
| 2016 | $3,575 | $98,300 | $43,000 | $55,300 |
| 2015 | $2,937 | $101,300 | $43,400 | $57,900 |
| 2014 | $2,912 | $101,300 | $43,400 | $57,900 |
| 2013 | $2,912 | $101,300 | $43,400 | $57,900 |
Source: Public Records
Map
Nearby Homes
- 0 Plainfield Pike Unit 1374314
- 50 Clemence St Unit 50
- 1301 Plainfield St
- 66 Clemence St
- 0 Clemence St
- 115 Clemence St
- 91 Curry Rd
- 9 Heritage Cir
- 77 Rockwood Ave
- 30 Fletcher Ave
- 27 Joy St
- 1476 Plainfield Pike
- 41 Yeoman Ave
- 10 Woodland Ave
- 44 Valente Dr
- 1189 Plainfield St
- 53 School St
- 149 Yeoman Ave
- 71 Woodland Ave
- 161 Holland St Unit 101
- 16 Myrtle Ave
- 19 Myrtle Ave
- 21 Myrtle Ave
- 12 Myrtle Ave
- 15 Myrtle Ave
- 0 Myrtle Ave
- 11 Myrtle Ave
- 7 Myrtle Ave
- 6 Myrtle Ave
- 74 Bingley Terrace
- 1359 Plainfield St
- 70 Bingley Terrace
- 68 Bingley Terrace
- 68-70 Bingley Terrace
- 66 Bingley Terrace
- 76 Bingley Terrace
- 1357 Plainfield St
- 67 Bingley Terrace Unit 67
- 71 Bingley Terrace
- 1382 Plainfield St