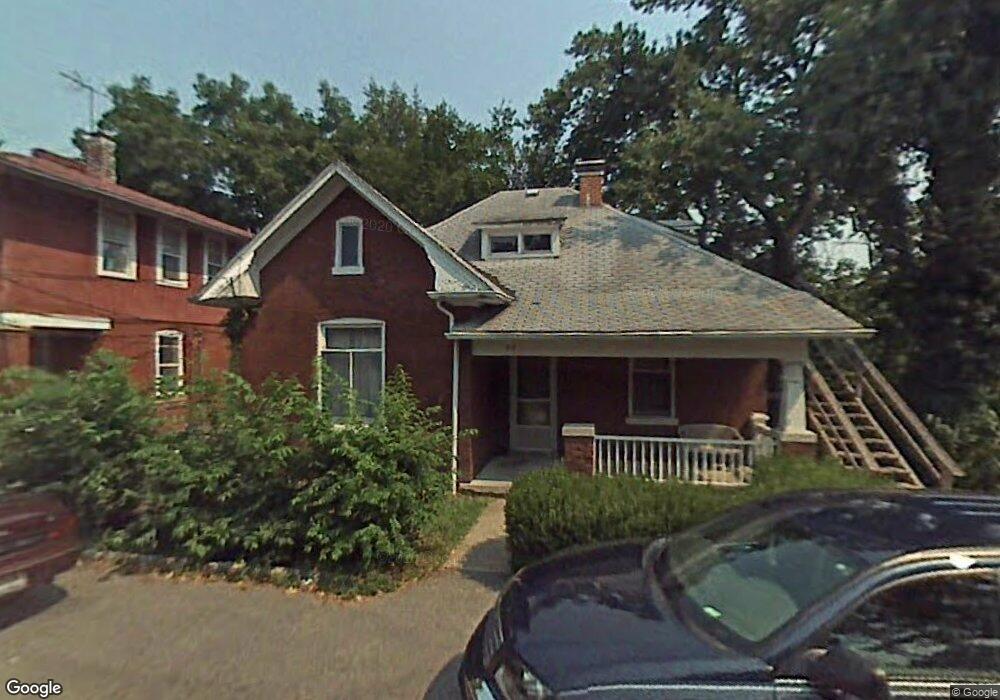
20 N 9th St Belleville, IL 62220
Estimated Value: $62,000 - $91,499
Studio
--
Bath
905
Sq Ft
$89/Sq Ft
Est. Value
About This Home
This home is located at 20 N 9th St, Belleville, IL 62220 and is currently estimated at $80,125, approximately $88 per square foot. 20 N 9th St is a home located in St. Clair County with nearby schools including Franklin Elementary School, Central Jr High School, and Governor French Academy.
Ownership History
Date
Name
Owned For
Owner Type
Purchase Details
Closed on
Apr 24, 2024
Sold by
Pine View Homebuyers Llc
Bought by
Mantia Sharon
Current Estimated Value
Purchase Details
Closed on
Apr 12, 2024
Sold by
Alliance Realty Services Llc
Bought by
Pine View Homebuyers Llc
Purchase Details
Closed on
Feb 27, 2013
Sold by
Illinois Holdings I Llc
Bought by
Alliance Realty Services Llc
Purchase Details
Closed on
Mar 9, 2007
Sold by
Illinois Holdings I Llc
Bought by
Loeffelman Wally
Purchase Details
Closed on
Jul 11, 2005
Sold by
Illinois Property Development Llc
Bought by
Illinois Holdings I Llc
Purchase Details
Closed on
Oct 20, 2004
Sold by
Goodwin Judith A and Goodwin Brenna
Bought by
Illinois Property Development
Home Financials for this Owner
Home Financials are based on the most recent Mortgage that was taken out on this home.
Original Mortgage
$41,000
Interest Rate
5.93%
Mortgage Type
Purchase Money Mortgage
Create a Home Valuation Report for This Property
The Home Valuation Report is an in-depth analysis detailing your home's value as well as a comparison with similar homes in the area
Home Values in the Area
Average Home Value in this Area
Purchase History
| Date | Buyer | Sale Price | Title Company |
|---|---|---|---|
| Mantia Sharon | $42,000 | None Available | |
| Pine View Homebuyers Llc | $30,500 | None Available | |
| Alliance Realty Services Llc | $8,000 | Town & Country Title Co | |
| Loeffelman Wally | -- | Integrity Land Title Co Inc | |
| Illinois Holdings I Llc | -- | Benchmark Title Company Llc | |
| Illinois Property Development | $41,000 | Benchmark Title Company |
Source: Public Records
Mortgage History
| Date | Status | Borrower | Loan Amount |
|---|---|---|---|
| Previous Owner | Illinois Property Development | $41,000 |
Source: Public Records
Tax History
| Year | Tax Paid | Tax Assessment Tax Assessment Total Assessment is a certain percentage of the fair market value that is determined by local assessors to be the total taxable value of land and additions on the property. | Land | Improvement |
|---|---|---|---|---|
| 2024 | $2,221 | $25,261 | $2,849 | $22,412 |
| 2023 | $2,171 | $23,128 | $2,793 | $20,335 |
| 2022 | $1,993 | $20,821 | $2,514 | $18,307 |
| 2021 | $1,919 | $19,248 | $2,324 | $16,924 |
| 2020 | $1,865 | $18,203 | $2,198 | $16,005 |
| 2019 | $1,809 | $17,466 | $2,201 | $15,265 |
| 2018 | $1,769 | $17,088 | $2,153 | $14,935 |
| 2017 | $1,755 | $16,968 | $2,138 | $14,830 |
| 2016 | $1,733 | $16,608 | $2,093 | $14,515 |
| 2014 | $919 | $19,576 | $3,824 | $15,752 |
| 2013 | $1,791 | $19,856 | $3,879 | $15,977 |
Source: Public Records
Map
Nearby Homes
Your Personal Tour Guide
Ask me questions while you tour the home.