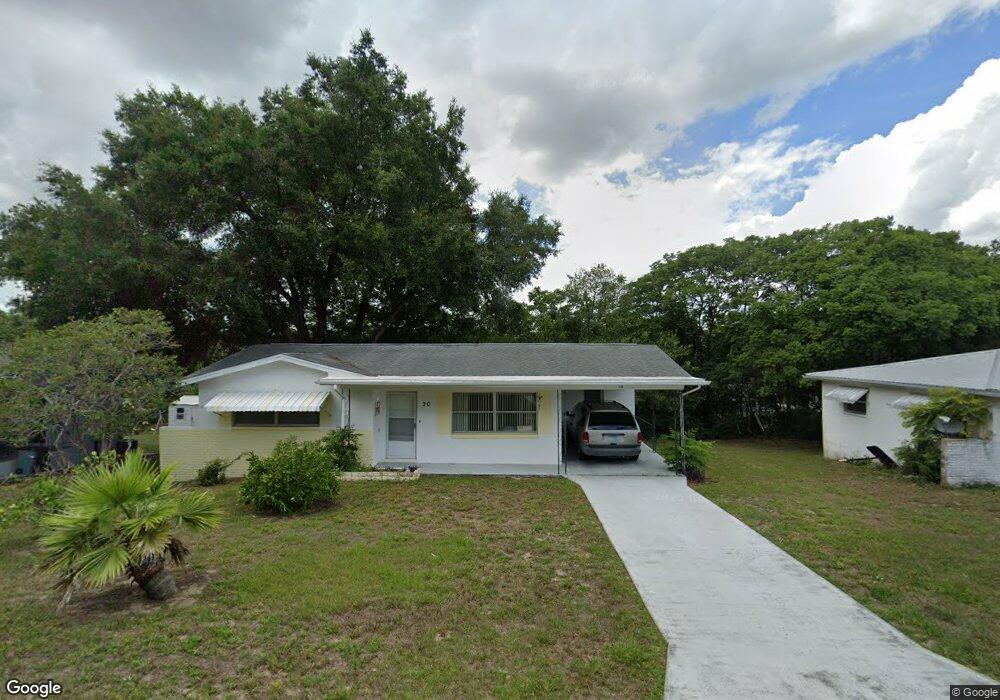
20 N Barbour St Unit 1 Beverly Hills, FL 34465
Estimated Value: $100,000 - $163,000
2
Beds
1
Bath
898
Sq Ft
$159/Sq Ft
Est. Value
About This Home
This home is located at 20 N Barbour St Unit 1, Beverly Hills, FL 34465 and is currently estimated at $143,174, approximately $159 per square foot. 20 N Barbour St Unit 1 is a home located in Citrus County with nearby schools including Central Ridge Elementary School, Citrus Springs Middle School, and Lecanto High School.
Ownership History
Date
Name
Owned For
Owner Type
Purchase Details
Closed on
Jun 25, 2024
Sold by
Delores R Tosel Trust and Tosel Delores R
Bought by
Tosel Taniah and Gingerich Jonas
Current Estimated Value
Home Financials for this Owner
Home Financials are based on the most recent Mortgage that was taken out on this home.
Original Mortgage
$60,000
Outstanding Balance
$59,440
Interest Rate
8.25%
Mortgage Type
New Conventional
Estimated Equity
$83,734
Purchase Details
Closed on
Apr 17, 2012
Sold by
Stephenson Peter D and Kp Equity Trust
Bought by
Tosel Delores R and Delores R Tosel Trust
Purchase Details
Closed on
Mar 9, 2011
Sold by
Clark Paul E and Clark Louise
Bought by
Stephenson Peter D and Kp Equity Trust
Purchase Details
Closed on
May 2, 2001
Sold by
Holy Bible Church Inc
Bought by
Clark Paul E and Clark Louise
Purchase Details
Closed on
May 1, 1999
Bought by
Tosel Delores E Trustee and Delores R Tosel Trust
Create a Home Valuation Report for This Property
The Home Valuation Report is an in-depth analysis detailing your home's value as well as a comparison with similar homes in the area
Home Values in the Area
Average Home Value in this Area
Purchase History
| Date | Buyer | Sale Price | Title Company |
|---|---|---|---|
| Tosel Taniah | $75,000 | Compass Title | |
| Tosel Delores R | $31,000 | Diversified Title Services | |
| Stephenson Peter D | $12,900 | Southern Security Title Serv | |
| Clark Paul E | $34,000 | Citrus Land Title | |
| Tosel Delores E Trustee | $28,000 | -- |
Source: Public Records
Mortgage History
| Date | Status | Borrower | Loan Amount |
|---|---|---|---|
| Open | Tosel Taniah | $60,000 |
Source: Public Records
Tax History Compared to Growth
Tax History
| Year | Tax Paid | Tax Assessment Tax Assessment Total Assessment is a certain percentage of the fair market value that is determined by local assessors to be the total taxable value of land and additions on the property. | Land | Improvement |
|---|---|---|---|---|
| 2024 | $1,269 | $117,257 | $10,550 | $106,707 |
| 2023 | $1,269 | $110,886 | $10,550 | $100,336 |
| 2022 | $1,058 | $84,217 | $9,460 | $74,757 |
| 2021 | $875 | $59,276 | $5,460 | $53,816 |
| 2020 | $757 | $53,023 | $5,460 | $47,563 |
| 2019 | $683 | $44,030 | $3,960 | $40,070 |
| 2018 | $607 | $38,180 | $3,590 | $34,590 |
| 2017 | $545 | $30,726 | $3,590 | $27,136 |
| 2016 | $508 | $26,168 | $3,590 | $22,578 |
| 2015 | $501 | $25,428 | $3,560 | $21,868 |
| 2014 | $515 | $25,360 | $3,705 | $21,655 |
Source: Public Records
Map
Nearby Homes
- 23 N Barbour St
- 8 N Adams St
- 3 N Wadsworth Ave
- 3 E Lemon St
- 5 E Golden St
- 10 S Barbour St
- 2 Esskay St
- 16 N Jackson St
- 5 S Melbourne St
- 15 E Murray St
- 996 W Colbert Ct
- 25 N Harrison St
- 31 N Harrison St
- 4 S Harrison St
- 995 W Starjasmine Place
- 16 S Harrison St
- 18 S Harrison St
- 931 W Starjasmine Place
- 34 S Adams St
- 4311 N Bacall Loop
- 22 N Barbour St
- 18 N Barbour St
- 19 N Wadsworth Ave
- 2 N Barbour St
- 21 N Wadsworth Ave
- 24 N Barbour St
- 16 N Barbour St
- 19 N Barbour St
- 21 N Barbour St
- 17 N Barbour St
- 23 N Wadsworth Ave
- 15 N Wadsworth Ave
- 14 N Barbour St
- 25 N Wadsworth Ave Unit 1
- 25 N Wadsworth Ave
- 15 N Barbour St
- 25 N Barbour St
- 20 N Wadsworth Ave
- 20 N Adams St
- 18 N Wadsworth Ave