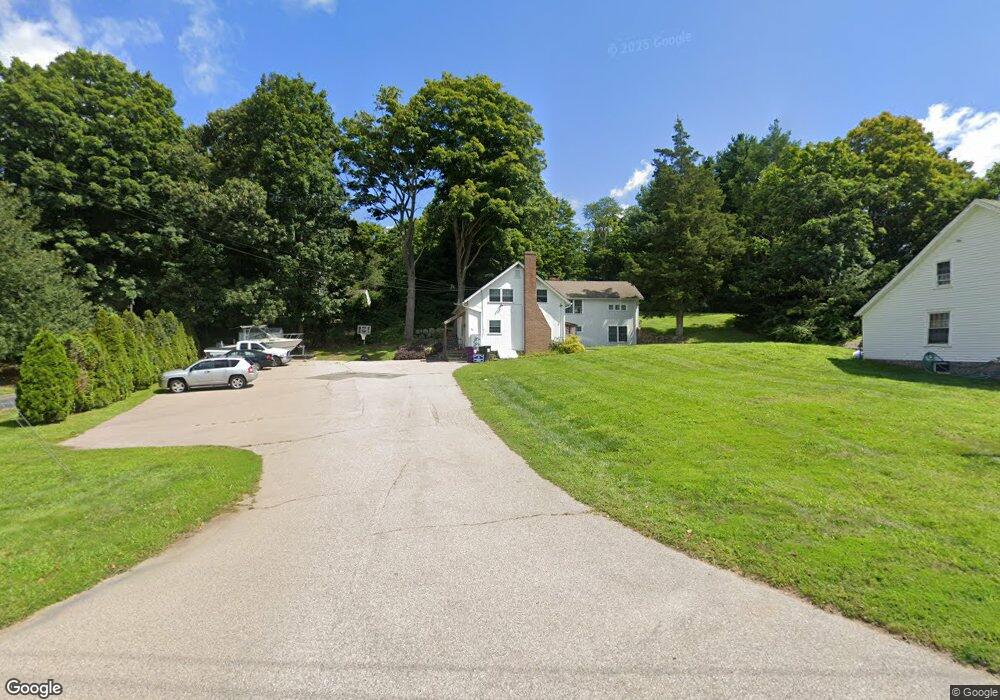
20 N High St Clinton, CT 06413
Estimated Value: $560,304
Studio
--
Bath
--
Sq Ft
37,026
Sq Ft Lot
About This Home
This home is located at 20 N High St, Clinton, CT 06413 and is currently estimated at $560,304. 20 N High St is a home located in Middlesex County with nearby schools including Lewin G. Joel Jr. School, The Morgan School, and Our Lady of Mercy Preparatory Academy.
Ownership History
Date
Name
Owned For
Owner Type
Purchase Details
Closed on
Nov 1, 2021
Sold by
Mkcarlin Llc
Bought by
20 North High St Assoc
Current Estimated Value
Purchase Details
Closed on
Sep 21, 2021
Sold by
20-22 North High St Assoc
Bought by
Mkcarlin Llc
Purchase Details
Closed on
Dec 21, 2017
Sold by
20-22 North High St Ll
Bought by
Mkcarlin Llc
Home Financials for this Owner
Home Financials are based on the most recent Mortgage that was taken out on this home.
Original Mortgage
$277,500
Interest Rate
3.9%
Mortgage Type
Purchase Money Mortgage
Purchase Details
Closed on
Sep 13, 2007
Sold by
Fischbein Fredric
Bought by
20-22 North High St As
Home Financials for this Owner
Home Financials are based on the most recent Mortgage that was taken out on this home.
Original Mortgage
$240,000
Interest Rate
11%
Mortgage Type
Commercial
Create a Home Valuation Report for This Property
The Home Valuation Report is an in-depth analysis detailing your home's value as well as a comparison with similar homes in the area
Home Values in the Area
Average Home Value in this Area
Purchase History
| Date | Buyer | Sale Price | Title Company |
|---|---|---|---|
| 20 North High St Assoc | $425,000 | None Available | |
| 20 North High St Assoc | $425,000 | None Available | |
| Mkcarlin Llc | $370,000 | None Available | |
| Mkcarlin Llc | $370,000 | None Available | |
| Mkcarlin Llc | $370,000 | -- | |
| Mkcarlin Llc | $370,000 | -- | |
| 20-22 North High St As | $300,000 | -- | |
| 20-22 North High St As | $300,000 | -- |
Source: Public Records
Mortgage History
| Date | Status | Borrower | Loan Amount |
|---|---|---|---|
| Previous Owner | Mkcarlin Llc | $277,500 | |
| Previous Owner | 20-22 North High St As | $240,000 | |
| Previous Owner | 20-22 North High St As | $240,000 |
Source: Public Records
Tax History
| Year | Tax Paid | Tax Assessment Tax Assessment Total Assessment is a certain percentage of the fair market value that is determined by local assessors to be the total taxable value of land and additions on the property. | Land | Improvement |
|---|---|---|---|---|
| 2025 | $8,956 | $287,600 | $55,300 | $232,300 |
| 2024 | $8,703 | $287,600 | $55,300 | $232,300 |
| 2023 | $8,579 | $287,600 | $55,300 | $232,300 |
| 2022 | $8,579 | $287,600 | $55,300 | $232,300 |
| 2021 | $5,647 | $189,300 | $43,500 | $145,800 |
| 2020 | $5,916 | $189,300 | $43,500 | $145,800 |
| 2019 | $5,916 | $189,300 | $43,500 | $145,800 |
| 2018 | $5,781 | $189,300 | $43,500 | $145,800 |
| 2017 | $5,662 | $189,300 | $43,500 | $145,800 |
| 2016 | $5,138 | $189,300 | $43,500 | $145,800 |
| 2015 | $4,907 | $183,300 | $32,600 | $150,700 |
| 2014 | $4,815 | $183,300 | $32,600 | $150,700 |
Source: Public Records
Map
Nearby Homes
- 64 W Main St
- 0 Cow Hill Rd
- 16 Silverbrook Ln
- 133 W Main St Unit MV1
- 133 W Main St Unit TRLR A9
- 38 Sunnybrook Ln
- 24 Indian Dr
- 22 Indian Dr
- 13 Waterside Ln
- 110 E Main St
- 6 Sandgate Cir
- 10 Runnymede Ln
- 3 Sandgate Cir
- 4 Currycross Rd Unit 4
- 144 E Main St Unit 5
- 151 E Main St Unit 12
- 153 E Main St Unit 10
- 153 E Main St Unit 13
- 153 E Main St Unit 31
- 153 E Main St Unit 8
Your Personal Tour Guide
Ask me questions while you tour the home.