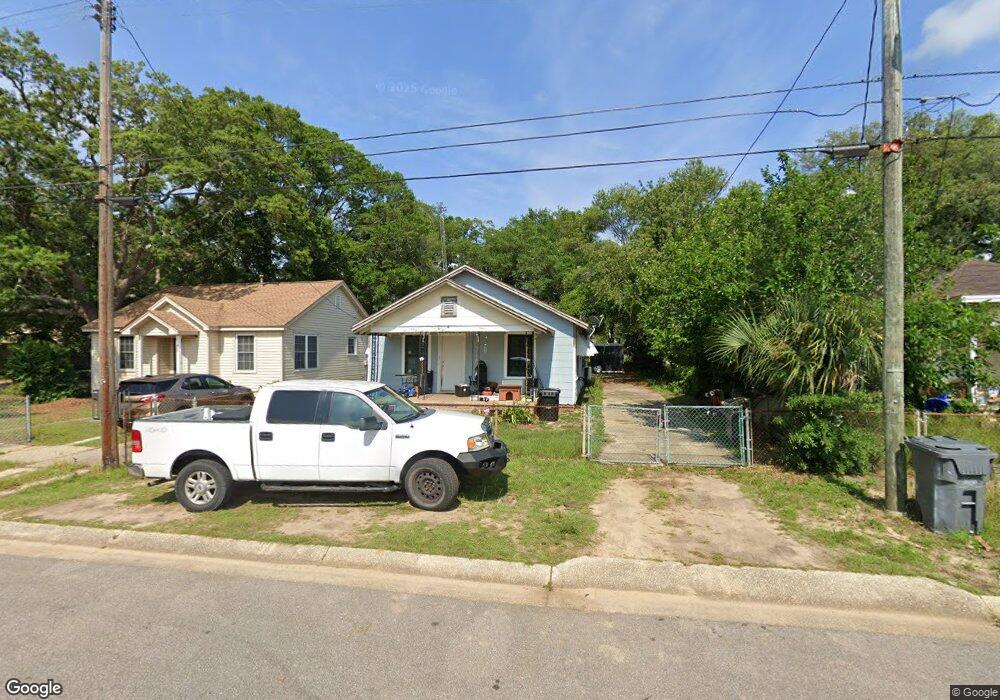
20 N I St Pensacola, FL 32502
Estimated Value: $161,114 - $279,000
--
Bed
1
Bath
1,135
Sq Ft
$187/Sq Ft
Est. Value
About This Home
This home is located at 20 N I St, Pensacola, FL 32502 and is currently estimated at $212,529, approximately $187 per square foot. 20 N I St is a home located in Escambia County with nearby schools including Warrington Middle School, Pensacola High School, and Episcopal Day School of Christ Church Parish.
Ownership History
Date
Name
Owned For
Owner Type
Purchase Details
Closed on
Jun 17, 2014
Sold by
Venn John E and Estate Of Sharon Kay Mccaul
Bought by
Williams Dale R
Current Estimated Value
Purchase Details
Closed on
Apr 5, 2014
Sold by
Williams Dale R and Williams Dale
Bought by
Venn John E and Mccaul Sharon Kay
Purchase Details
Closed on
Jul 1, 1999
Sold by
Gay Ricky D
Bought by
Day Shelly
Home Financials for this Owner
Home Financials are based on the most recent Mortgage that was taken out on this home.
Original Mortgage
$26,500
Interest Rate
7.23%
Create a Home Valuation Report for This Property
The Home Valuation Report is an in-depth analysis detailing your home's value as well as a comparison with similar homes in the area
Home Values in the Area
Average Home Value in this Area
Purchase History
| Date | Buyer | Sale Price | Title Company |
|---|---|---|---|
| Williams Dale R | $17,000 | None Available | |
| Venn John E | $55,000 | None Available | |
| Day Shelly | $30,000 | -- |
Source: Public Records
Mortgage History
| Date | Status | Borrower | Loan Amount |
|---|---|---|---|
| Previous Owner | Day Shelly | $26,500 |
Source: Public Records
Tax History Compared to Growth
Tax History
| Year | Tax Paid | Tax Assessment Tax Assessment Total Assessment is a certain percentage of the fair market value that is determined by local assessors to be the total taxable value of land and additions on the property. | Land | Improvement |
|---|---|---|---|---|
| 2024 | $1,453 | $97,841 | $30,384 | $67,457 |
| 2023 | $1,453 | $77,927 | $0 | $0 |
| 2022 | $1,346 | $87,361 | $30,384 | $56,977 |
| 2021 | $1,249 | $77,451 | $0 | $0 |
| 2020 | $1,107 | $66,884 | $0 | $0 |
| 2019 | $1,038 | $64,136 | $0 | $0 |
| 2018 | $984 | $61,388 | $0 | $0 |
| 2017 | $912 | $55,236 | $0 | $0 |
| 2016 | $776 | $39,991 | $0 | $0 |
| 2015 | $755 | $38,354 | $0 | $0 |
| 2014 | $729 | $36,643 | $0 | $0 |
Source: Public Records
Map
Nearby Homes