Estimated Value: $158,000 - $180,231
3
Beds
1
Bath
972
Sq Ft
$171/Sq Ft
Est. Value
About This Home
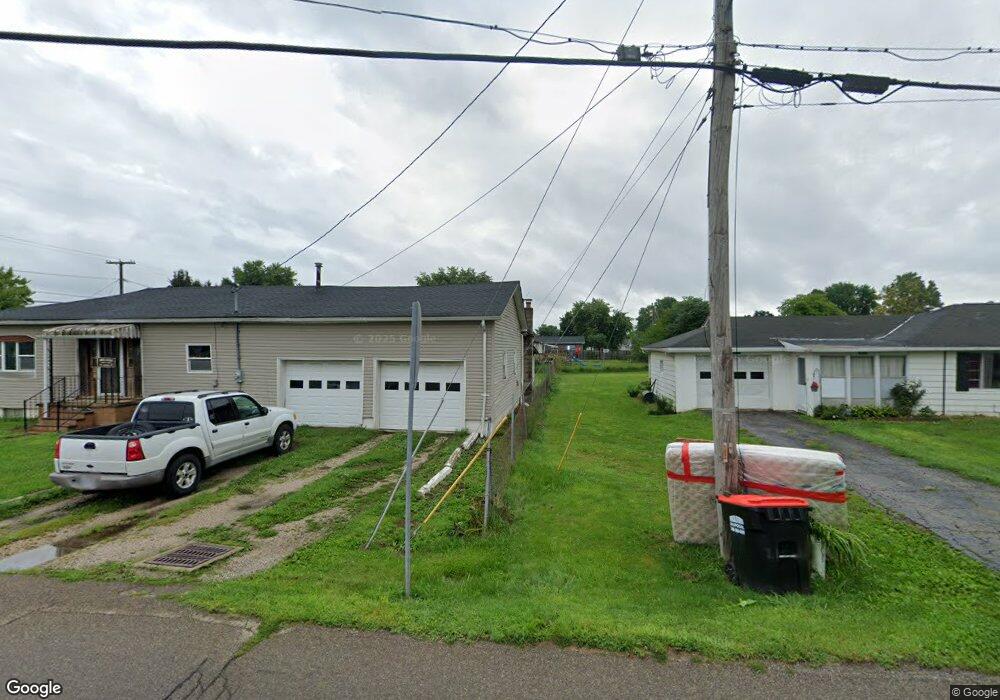
This home is located at 20 N Jefferson St, Utica, OH 43080 and is currently estimated at $166,558, approximately $171 per square foot. 20 N Jefferson St is a home located in Licking County with nearby schools including Utica High School.
Ownership History
Date
Name
Owned For
Owner Type
Purchase Details
Closed on
Aug 2, 2018
Sold by
Ryan David C and Robey Christina
Bought by
Ryan Broderick and Ryan Amber
Current Estimated Value
Home Financials for this Owner
Home Financials are based on the most recent Mortgage that was taken out on this home.
Original Mortgage
$80,666
Outstanding Balance
$70,055
Interest Rate
4.5%
Mortgage Type
New Conventional
Estimated Equity
$96,503
Purchase Details
Closed on
Aug 27, 2008
Sold by
Hud
Bought by
Ryan David C and Robey Christina
Home Financials for this Owner
Home Financials are based on the most recent Mortgage that was taken out on this home.
Original Mortgage
$41,525
Interest Rate
6.66%
Mortgage Type
Unknown
Purchase Details
Closed on
Dec 21, 2007
Sold by
Lumpkin Nina R
Bought by
Huntington National Bank
Purchase Details
Closed on
May 12, 2003
Sold by
Devine Ginger L and Devine Edward T
Bought by
Lumpkin Nina R
Home Financials for this Owner
Home Financials are based on the most recent Mortgage that was taken out on this home.
Original Mortgage
$79,373
Interest Rate
5.87%
Mortgage Type
FHA
Create a Home Valuation Report for This Property
The Home Valuation Report is an in-depth analysis detailing your home's value as well as a comparison with similar homes in the area
Home Values in the Area
Average Home Value in this Area
Purchase History
| Date | Buyer | Sale Price | Title Company |
|---|---|---|---|
| Ryan Broderick | $75,000 | None Available | |
| Ryan David C | $48,525 | Lakeside T | |
| Huntington National Bank | $60,000 | None Available | |
| Lumpkin Nina R | $80,000 | Tradition Title Agency Inc |
Source: Public Records
Mortgage History
| Date | Status | Borrower | Loan Amount |
|---|---|---|---|
| Open | Ryan Broderick | $80,666 | |
| Previous Owner | Ryan David C | $41,525 | |
| Previous Owner | Lumpkin Nina R | $79,373 |
Source: Public Records
Tax History Compared to Growth
Tax History
| Year | Tax Paid | Tax Assessment Tax Assessment Total Assessment is a certain percentage of the fair market value that is determined by local assessors to be the total taxable value of land and additions on the property. | Land | Improvement |
|---|---|---|---|---|
| 2024 | $1,543 | $41,410 | $10,290 | $31,120 |
| 2023 | $1,546 | $41,410 | $10,290 | $31,120 |
| 2022 | $1,164 | $31,400 | $6,440 | $24,960 |
| 2021 | $1,190 | $31,400 | $6,440 | $24,960 |
| 2020 | $1,190 | $31,400 | $6,440 | $24,960 |
| 2019 | $1,017 | $25,100 | $5,150 | $19,950 |
| 2018 | $1,018 | $0 | $0 | $0 |
| 2017 | $1,079 | $0 | $0 | $0 |
| 2016 | $1,147 | $0 | $0 | $0 |
| 2015 | $1,136 | $0 | $0 | $0 |
| 2014 | $1,550 | $0 | $0 | $0 |
| 2013 | $1,101 | $0 | $0 | $0 |
Source: Public Records
Map
Nearby Homes
- 307 Spring St
- 312 Mill St
- 44 Maple Ave
- 500 North St Unit LOT 29
- 523 North St
- 4348 Johnstown Utica Rd NE
- 4136 Johnstown Utica Rd NE
- 80 Morningside Dr
- 0 Purity Rd Unit 225038778
- 9962 Weaver Rd
- 10924 Mount Vernon Rd
- 0 Stout Rd
- 1106 Homer Rd NW
- 0 Dog Hollow Rd Unit LOT 8 224025180
- 0 Dog Hollow Rd Unit LOT 5
- 13062 Fosdyke Rd
- 2800 Weaver Rd
- 13944 Lafayette Rd
- 4965 Newark Rd
- 4380 Weaver Rd
- 30 N Jefferson St
- 317 Spring St
- 40 N Jefferson St
- 23 N Jefferson St
- 329 Spring St
- 33 N Jefferson St
- 54 N Jefferson St
- 43 N Jefferson St
- 0 Spring St Unit B 2639820
- 0 Spring St Unit Lot A
- 1008 Jo Ann Dr
- 337 Spring St
- 53 Jefferson St
- 223 Spring St
- 349 Spring St
- 65 N Jefferson St
- 215 Spring St
- 342 Spring St
- 72 N Jefferson St
- 361 Spring St