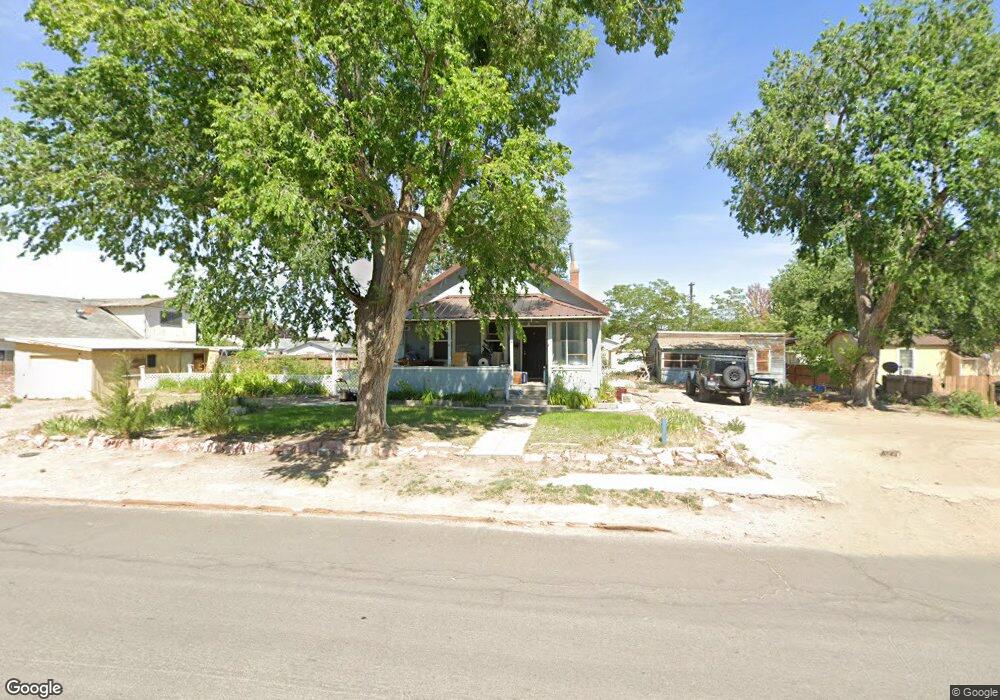
20 N Nevada St Yerington, NV 89447
Estimated Value: $185,000 - $268,000
3
Beds
1
Bath
784
Sq Ft
$296/Sq Ft
Est. Value
About This Home
This home is located at 20 N Nevada St, Yerington, NV 89447 and is currently estimated at $231,811, approximately $295 per square foot. 20 N Nevada St is a home located in Lyon County with nearby schools including Yerington Elementary School, Yerington Intermediate School, and Yerington High School.
Ownership History
Date
Name
Owned For
Owner Type
Purchase Details
Closed on
Mar 26, 2013
Sold by
Hawkeswood Betty F
Bought by
Sinclair Michelle
Current Estimated Value
Home Financials for this Owner
Home Financials are based on the most recent Mortgage that was taken out on this home.
Original Mortgage
$54,795
Outstanding Balance
$38,678
Interest Rate
3.47%
Mortgage Type
New Conventional
Estimated Equity
$193,133
Create a Home Valuation Report for This Property
The Home Valuation Report is an in-depth analysis detailing your home's value as well as a comparison with similar homes in the area
Home Values in the Area
Average Home Value in this Area
Purchase History
| Date | Buyer | Sale Price | Title Company |
|---|---|---|---|
| Sinclair Michelle | $52,500 | Title Services & Escrow Co |
Source: Public Records
Mortgage History
| Date | Status | Borrower | Loan Amount |
|---|---|---|---|
| Open | Sinclair Michelle | $54,795 |
Source: Public Records
Tax History Compared to Growth
Tax History
| Year | Tax Paid | Tax Assessment Tax Assessment Total Assessment is a certain percentage of the fair market value that is determined by local assessors to be the total taxable value of land and additions on the property. | Land | Improvement |
|---|---|---|---|---|
| 2025 | $668 | $45,724 | $31,500 | $14,224 |
| 2024 | $649 | $44,718 | $30,800 | $13,918 |
| 2023 | $649 | $43,549 | $30,800 | $12,749 |
| 2022 | $612 | $41,798 | $30,800 | $10,998 |
| 2021 | $594 | $17,492 | $7,000 | $10,492 |
| 2020 | $576 | $17,280 | $7,000 | $10,280 |
| 2019 | $560 | $16,781 | $7,000 | $9,781 |
| 2018 | $543 | $14,847 | $5,500 | $9,347 |
| 2017 | $538 | $14,689 | $5,500 | $9,189 |
| 2016 | $527 | $14,986 | $5,950 | $9,036 |
| 2015 | $526 | $14,718 | $5,950 | $8,768 |
| 2014 | $511 | $14,388 | $5,950 | $8,438 |
Source: Public Records
Map
Nearby Homes
- 9 N Nevada St
- 317 Modesto St
- 41 Nevada 208
- 0 Nevada 208
- 104 Virginia St
- 115 Commercial Ave
- 244 Valley Dr
- 200 Quail Run Dr
- 0 S Whitacre St Unit 250001435
- 204 Quail Run Dr
- 234 S West St
- 311 S Main St
- 616 S Center St
- 321 S West St
- 329 S West St
- 13ac S Whitacre St
- 500 W Goldfield Ave Unit 31
- 500 W Goldfield Ave Unit 32
- 500 W Goldfield Ave Unit 27
- 416 Paul Ave
- 26 N Nevada St
- 10 N Nevada St Unit NAME
- 10 N Nevada St
- 32 N Nevada St
- 17 N California St
- 110 Broadway Ave
- 23 N California St
- 112 Broadway Ave
- 2 N Nevada St
- 15 N California St
- 27 N California St
- 118 Broadway Ave
- 19 N Nevada St
- 19 N Nevada St
- 11 N Nevada St
- 31 N California St
- 9 N Nevada St
- 25 N Nevada St
- 35 N California St
- 45 N Nevada St