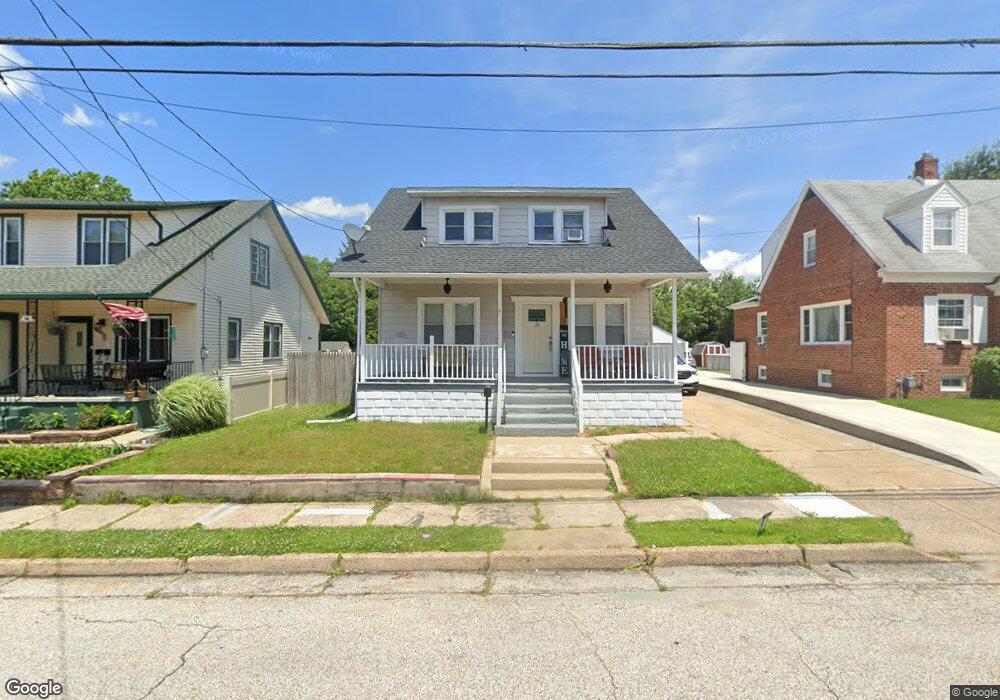
20 N Oakland Ave Runnemede, NJ 08078
Estimated Value: $303,033 - $313,000
3
Beds
2
Baths
1,346
Sq Ft
$228/Sq Ft
Est. Value
About This Home
This home is located at 20 N Oakland Ave, Runnemede, NJ 08078 and is currently estimated at $307,508, approximately $228 per square foot. 20 N Oakland Ave is a home located in Camden County with nearby schools including Mary E. Volz Elementary School, Bingham Elementary School, and Triton High School.
Ownership History
Date
Name
Owned For
Owner Type
Purchase Details
Closed on
May 20, 2021
Sold by
Vervelakis Marilyn and Vervelakis John
Bought by
Melendez Jonthony Alberto
Current Estimated Value
Home Financials for this Owner
Home Financials are based on the most recent Mortgage that was taken out on this home.
Original Mortgage
$201,188
Interest Rate
2.9%
Mortgage Type
FHA
Purchase Details
Closed on
Jul 12, 2006
Sold by
Hyatt William
Bought by
Vervelakis Marilyn
Home Financials for this Owner
Home Financials are based on the most recent Mortgage that was taken out on this home.
Original Mortgage
$130,400
Interest Rate
6.7%
Purchase Details
Closed on
Apr 13, 1999
Sold by
Stratton Robert W
Bought by
Kelly Patrick A and Baker Genevieve M
Create a Home Valuation Report for This Property
The Home Valuation Report is an in-depth analysis detailing your home's value as well as a comparison with similar homes in the area
Home Values in the Area
Average Home Value in this Area
Purchase History
| Date | Buyer | Sale Price | Title Company |
|---|---|---|---|
| Melendez Jonthony Alberto | $204,900 | None Available | |
| Vervelakis Marilyn | $163,000 | -- | |
| Kelly Patrick A | $51,000 | -- |
Source: Public Records
Mortgage History
| Date | Status | Borrower | Loan Amount |
|---|---|---|---|
| Previous Owner | Melendez Jonthony Alberto | $201,188 | |
| Previous Owner | Vervelakis Marilyn | $130,400 |
Source: Public Records
Tax History Compared to Growth
Tax History
| Year | Tax Paid | Tax Assessment Tax Assessment Total Assessment is a certain percentage of the fair market value that is determined by local assessors to be the total taxable value of land and additions on the property. | Land | Improvement |
|---|---|---|---|---|
| 2025 | $5,610 | $124,500 | $45,000 | $79,500 |
| 2024 | $5,439 | $124,500 | $45,000 | $79,500 |
| 2023 | $5,439 | $124,500 | $45,000 | $79,500 |
| 2022 | $5,266 | $124,500 | $45,000 | $79,500 |
| 2021 | $5,142 | $124,500 | $45,000 | $79,500 |
| 2020 | $5,091 | $124,500 | $45,000 | $79,500 |
| 2019 | $4,997 | $124,500 | $45,000 | $79,500 |
| 2018 | $4,902 | $124,500 | $45,000 | $79,500 |
| 2017 | $4,776 | $124,500 | $45,000 | $79,500 |
| 2016 | $4,716 | $124,500 | $45,000 | $79,500 |
| 2015 | $4,730 | $124,500 | $45,000 | $79,500 |
| 2014 | $4,669 | $124,500 | $45,000 | $79,500 |
Source: Public Records
Map
Nearby Homes
- 21 S Oakland Ave
- 115 W 1st Ave
- 39 E 2nd Ave
- 27 E 3rd Ave
- 37 Whaler Ave
- 41 Whaler Ave
- 43 Whaler Ave
- 45 Whaler Ave
- 47 Whaler Dr
- 37 W 5th Ave
- 206 W 5th Ave
- 14 E Evesham Rd
- 200 Knight Ave
- 524 Hirsch Ave
- 230 E Evesham Rd Unit B-1
- 230 E Evesham Rd Unit C15
- 30 12th Ave
- 525 W Evesham Rd
- 1100 Central Ave
- 232 Garden Terrace
- 24 N Oakland Ave
- 16 N Oakland Ave
- 28 N Oakland Ave
- 123 W Clements Bridge Rd Unit 113 B
- 123 W Clements Bridge Rd
- 25 Bowers Ave
- 17 Bowers Ave
- 30 N Oakland Ave
- 33 Bowers Ave
- 113 W Clements Bridge Rd Unit 223B
- 113 W Clements Bridge Rd Unit 113B
- 113 W Clements Bridge Rd Unit 113A
- 127 W Clements Bridge Rd
- 21 N Oakland Ave
- 19 N Oakland Ave
- 37 Bowers Ave
- 201 W Clements Bridge Rd
- 101 E Clements Bridge Rd
- 102 W Clements Bridge Rd
- 149 W Clements Bridge Rd