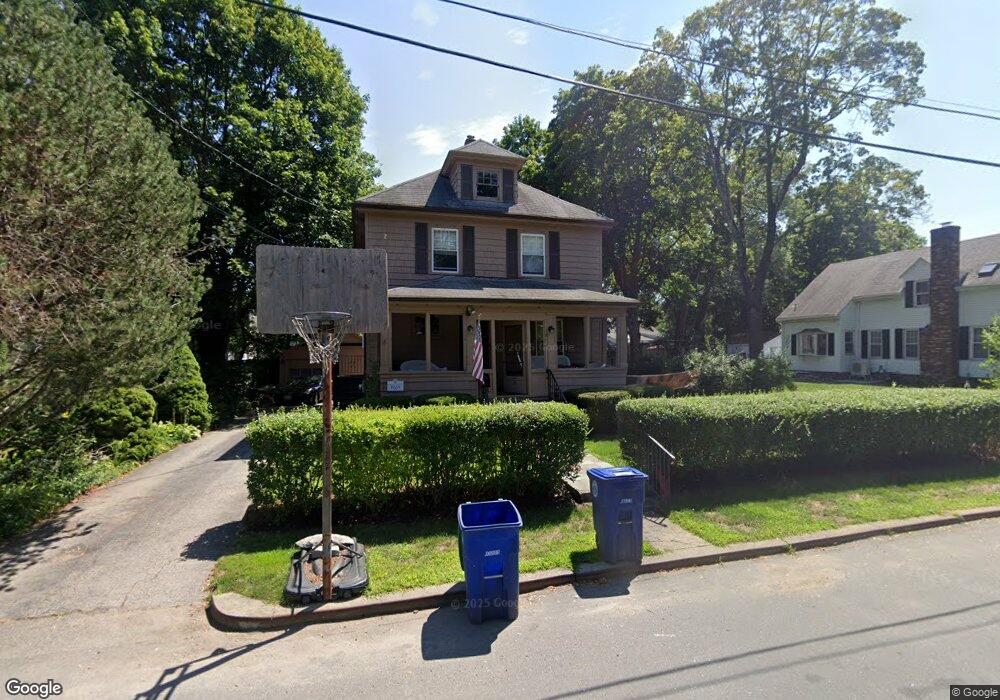
20 Nelson St Braintree, MA 02184
East Braintree NeighborhoodEstimated Value: $581,000 - $623,000
3
Beds
2
Baths
1,248
Sq Ft
$484/Sq Ft
Est. Value
About This Home
This home is located at 20 Nelson St, Braintree, MA 02184 and is currently estimated at $604,496, approximately $484 per square foot. 20 Nelson St is a home located in Norfolk County with nearby schools including Braintree High School, Sacred Heart Elementary School, and South Shore Christian Academy.
Ownership History
Date
Name
Owned For
Owner Type
Purchase Details
Closed on
Nov 24, 2010
Sold by
Zanca Joseph F
Bought by
Donovan Sara K and Donovan Timothy E
Current Estimated Value
Home Financials for this Owner
Home Financials are based on the most recent Mortgage that was taken out on this home.
Original Mortgage
$252,000
Outstanding Balance
$165,445
Interest Rate
4.25%
Mortgage Type
Purchase Money Mortgage
Estimated Equity
$439,051
Purchase Details
Closed on
Jun 14, 2010
Sold by
Peacock Roselyn and Joslin Meredith
Bought by
Zanca Joseph F
Home Financials for this Owner
Home Financials are based on the most recent Mortgage that was taken out on this home.
Original Mortgage
$160,000
Interest Rate
5.11%
Mortgage Type
Purchase Money Mortgage
Purchase Details
Closed on
Mar 26, 2009
Sold by
Lavery Arline I
Bought by
Lavery Arline I and Peacock Roselyn
Create a Home Valuation Report for This Property
The Home Valuation Report is an in-depth analysis detailing your home's value as well as a comparison with similar homes in the area
Home Values in the Area
Average Home Value in this Area
Purchase History
| Date | Buyer | Sale Price | Title Company |
|---|---|---|---|
| Donovan Sara K | $315,000 | -- | |
| Zanca Joseph F | $225,000 | -- | |
| Lavery Arline I | -- | -- |
Source: Public Records
Mortgage History
| Date | Status | Borrower | Loan Amount |
|---|---|---|---|
| Open | Donovan Sara K | $252,000 | |
| Previous Owner | Zanca Joseph F | $160,000 |
Source: Public Records
Tax History
| Year | Tax Paid | Tax Assessment Tax Assessment Total Assessment is a certain percentage of the fair market value that is determined by local assessors to be the total taxable value of land and additions on the property. | Land | Improvement |
|---|---|---|---|---|
| 2025 | $5,635 | $564,600 | $325,100 | $239,500 |
| 2024 | $5,085 | $536,400 | $303,100 | $233,300 |
| 2023 | $4,811 | $492,900 | $272,400 | $220,500 |
| 2022 | $4,642 | $466,500 | $246,000 | $220,500 |
| 2021 | $4,279 | $430,000 | $222,300 | $207,700 |
| 2020 | $3,952 | $400,800 | $202,100 | $198,700 |
| 2019 | $3,835 | $380,100 | $193,300 | $186,800 |
| 2018 | $3,740 | $354,800 | $175,700 | $179,100 |
| 2017 | $3,605 | $335,700 | $166,900 | $168,800 |
| 2016 | $3,430 | $312,400 | $140,600 | $171,800 |
| 2015 | $3,371 | $304,500 | $138,800 | $165,700 |
| 2014 | $3,148 | $275,700 | $126,500 | $149,200 |
Source: Public Records
Map
Nearby Homes
- 125 Allen St Unit A
- 16 Beechwood Rd
- 51 Faxon St
- 41 Lantern Ln
- 37 Lantern Ln
- 10 Skyline Dr Unit 5
- 30 Skyline Dr Unit 6
- 97 Liberty St
- 583 Union St
- 25 W Howard St Unit C3
- 122 Washington St Unit Twenty-two
- 255 River St
- 11 Richmond St
- 25 Richmond St
- 15 Summer St
- 114 Broad St Unit D
- 298 Lisle St
- 16 Lindbergh Ave
- 200 Falls Blvd Unit B305
- 46 Roosevelt Rd
Your Personal Tour Guide
Ask me questions while you tour the home.