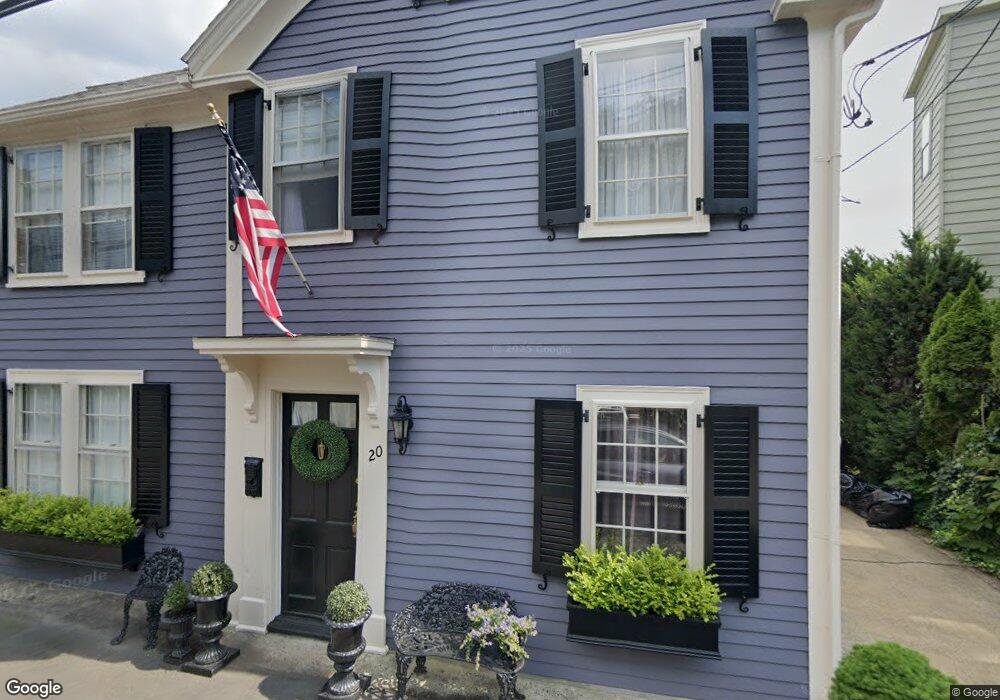
20 Nicholson St Marblehead, MA 01945
Estimated Value: $756,000 - $1,188,000
3
Beds
2
Baths
1,804
Sq Ft
$576/Sq Ft
Est. Value
About This Home
This home is located at 20 Nicholson St, Marblehead, MA 01945 and is currently estimated at $1,038,553, approximately $575 per square foot. 20 Nicholson St is a home located in Essex County with nearby schools including Marblehead High School, Marblehead Community Charter Public School, and Devereux School.
Ownership History
Date
Name
Owned For
Owner Type
Purchase Details
Closed on
Aug 10, 2009
Sold by
Chapdelaine George R
Bought by
Otoole Sandra
Current Estimated Value
Home Financials for this Owner
Home Financials are based on the most recent Mortgage that was taken out on this home.
Original Mortgage
$275,000
Outstanding Balance
$181,665
Interest Rate
5.47%
Mortgage Type
Purchase Money Mortgage
Estimated Equity
$856,888
Purchase Details
Closed on
Oct 6, 2003
Sold by
Barker Edmund J and Cane Pamela M
Bought by
Chapdelaine George R
Purchase Details
Closed on
May 30, 2001
Sold by
Legon Jane L
Bought by
Barker Edmund J and Came Pamela M
Purchase Details
Closed on
Jan 28, 1999
Sold by
Livingston Susan C
Bought by
Legon Jane L and Legon Lewis A
Purchase Details
Closed on
Oct 4, 1989
Sold by
Lund Dennis
Bought by
Livingston Susan
Create a Home Valuation Report for This Property
The Home Valuation Report is an in-depth analysis detailing your home's value as well as a comparison with similar homes in the area
Home Values in the Area
Average Home Value in this Area
Purchase History
| Date | Buyer | Sale Price | Title Company |
|---|---|---|---|
| Otoole Sandra | $538,000 | -- | |
| Otoole Sandra | $538,000 | -- | |
| Chapdelaine George R | $570,000 | -- | |
| Chapdelaine George R | $570,000 | -- | |
| Barker Edmund J | $471,000 | -- | |
| Barker Edmund J | $471,000 | -- | |
| Legon Jane L | $325,000 | -- | |
| Legon Jane L | $325,000 | -- | |
| Livingston Susan | $243,000 | -- |
Source: Public Records
Mortgage History
| Date | Status | Borrower | Loan Amount |
|---|---|---|---|
| Open | Livingston Susan | $275,000 | |
| Closed | Livingston Susan | $275,000 |
Source: Public Records
Tax History
| Year | Tax Paid | Tax Assessment Tax Assessment Total Assessment is a certain percentage of the fair market value that is determined by local assessors to be the total taxable value of land and additions on the property. | Land | Improvement |
|---|---|---|---|---|
| 2025 | $8,846 | $977,500 | $689,000 | $288,500 |
| 2024 | $8,567 | $956,100 | $689,000 | $267,100 |
| 2023 | $8,031 | $803,100 | $593,600 | $209,500 |
| 2022 | $7,929 | $753,700 | $530,000 | $223,700 |
| 2021 | $7,743 | $743,100 | $519,400 | $223,700 |
| 2020 | $7,193 | $692,300 | $508,800 | $183,500 |
| 2019 | $7,094 | $660,500 | $477,000 | $183,500 |
| 2018 | $6,695 | $607,500 | $424,000 | $183,500 |
| 2017 | $6,455 | $586,300 | $402,800 | $183,500 |
| 2016 | $5,966 | $537,500 | $360,400 | $177,100 |
| 2015 | $5,721 | $516,300 | $339,200 | $177,100 |
| 2014 | $5,650 | $509,500 | $339,200 | $170,300 |
Source: Public Records
Map
Nearby Homes
- 66 Pleasant St Unit 2
- 26 Summer St Unit 1
- 132 Elm St
- 132 Elm St Unit 132
- 290 Washington St Unit A
- 45 Pleasant St
- 7 Lee St Unit 1
- 41 Atlantic Ave Unit 3
- 41 Atlantic Ave Unit 1
- 9 Darling St
- 55 Brackett Place Unit B
- 6 Mount Vernon St
- 7 Cottage St
- 3 Frost Ln Unit 1
- 7 Mechanic Ct
- 55 Roosevelt Ave
- 9 Lincoln Park
- 23 Wyman Rd
- 30 Haley Rd Unit 1
- 70 Maverick St
- 233 Washington St
- 24 Nicholson St Unit 3
- 24 Nicholson St Unit 2
- 24 Nicholson St Unit 1
- 235 Washington St Unit 2
- 235 Washington St Unit 2
- 235 Washington St Unit 1
- 235 Washington St
- 235 Washington St
- 235 Washington St Unit 235
- 235 Washington St Unit 3
- 227 Washington St
- 231 Washington St Unit 2
- 231 Washington St
- 21 Nicholson St Unit 4
- 21 Nicholson St Unit 3
- 21 Nicholson St Unit 2
- 21 Nicholson St Unit 1
- 237 Washington St Unit 3B
- 237 Washington St
Your Personal Tour Guide
Ask me questions while you tour the home.