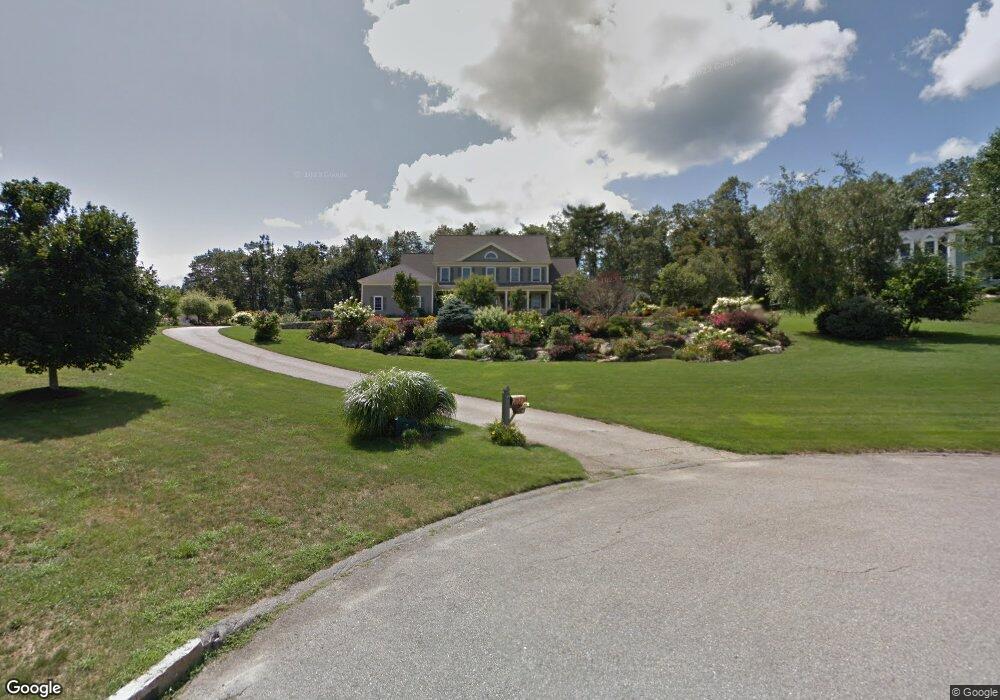
20 Nipmuc Rd Paxton, MA 01612
Estimated Value: $850,580 - $932,000
5
Beds
4
Baths
3,471
Sq Ft
$254/Sq Ft
Est. Value
About This Home
This home is located at 20 Nipmuc Rd, Paxton, MA 01612 and is currently estimated at $882,395, approximately $254 per square foot. 20 Nipmuc Rd is a home located in Worcester County with nearby schools including Wachusett Regional High School and Worcester Seventh-Day Adventist School.
Ownership History
Date
Name
Owned For
Owner Type
Purchase Details
Closed on
Apr 4, 2016
Sold by
Laracy Joan D
Bought by
Laracy John P and Laracy Joan D
Current Estimated Value
Purchase Details
Closed on
May 5, 1998
Sold by
Muir Farm Lp
Bought by
Laracy John P and Laracy Joan D
Create a Home Valuation Report for This Property
The Home Valuation Report is an in-depth analysis detailing your home's value as well as a comparison with similar homes in the area
Home Values in the Area
Average Home Value in this Area
Purchase History
| Date | Buyer | Sale Price | Title Company |
|---|---|---|---|
| Laracy John P | -- | -- | |
| Laracy Joan D | -- | -- | |
| Laracy John P | $65,000 | -- |
Source: Public Records
Mortgage History
| Date | Status | Borrower | Loan Amount |
|---|---|---|---|
| Previous Owner | Laracy John P | $118,000 | |
| Previous Owner | Laracy John P | $195,000 | |
| Previous Owner | Laracy John P | $97,200 |
Source: Public Records
Tax History Compared to Growth
Tax History
| Year | Tax Paid | Tax Assessment Tax Assessment Total Assessment is a certain percentage of the fair market value that is determined by local assessors to be the total taxable value of land and additions on the property. | Land | Improvement |
|---|---|---|---|---|
| 2025 | $12,396 | $841,000 | $124,000 | $717,000 |
| 2024 | $11,652 | $725,100 | $124,000 | $601,100 |
| 2023 | $11,213 | $637,800 | $112,600 | $525,200 |
| 2022 | $10,868 | $572,600 | $112,600 | $460,000 |
| 2021 | $10,899 | $552,400 | $104,100 | $448,300 |
| 2020 | $10,711 | $542,900 | $94,600 | $448,300 |
| 2019 | $10,379 | $525,800 | $85,700 | $440,100 |
| 2018 | $9,796 | $479,500 | $76,700 | $402,800 |
| 2017 | $9,879 | $484,500 | $73,000 | $411,500 |
| 2016 | $9,531 | $462,900 | $73,000 | $389,900 |
| 2015 | $9,335 | $449,000 | $73,000 | $376,000 |
| 2014 | $9,018 | $439,700 | $73,000 | $366,700 |
Source: Public Records
Map
Nearby Homes
- 19 Nipmuck Rd
- 18 Nipmuc Rd
- 25 Nipmuck Rd
- 22 Nipmuc Rd
- 19 Nipmuc Rd
- 202 Pleasant St
- 15 Nipmuc Rd
- 9 Indian Hill Rd
- 14 Nipmuc Rd
- 11 Nipmuc Rd
- 25 Indian Hill Rd
- 17 Indian Hill Rd
- 15 Indian Hill Rd
- 204 Pleasant St
- 12 Nipmuc Rd
- 13 Indian Hill Rd
- 10 Nipmuc Rd
- 1 Squantum Rd
- 11 Indian Hill Rd
- 20 Indian Hill Rd