
Landlord's Agent in 2024
Brandon Muroff
Brandon Muroff
(617) 240-2007
37 Total Sales
Estimated Value: $1,312,795 - $1,359,000
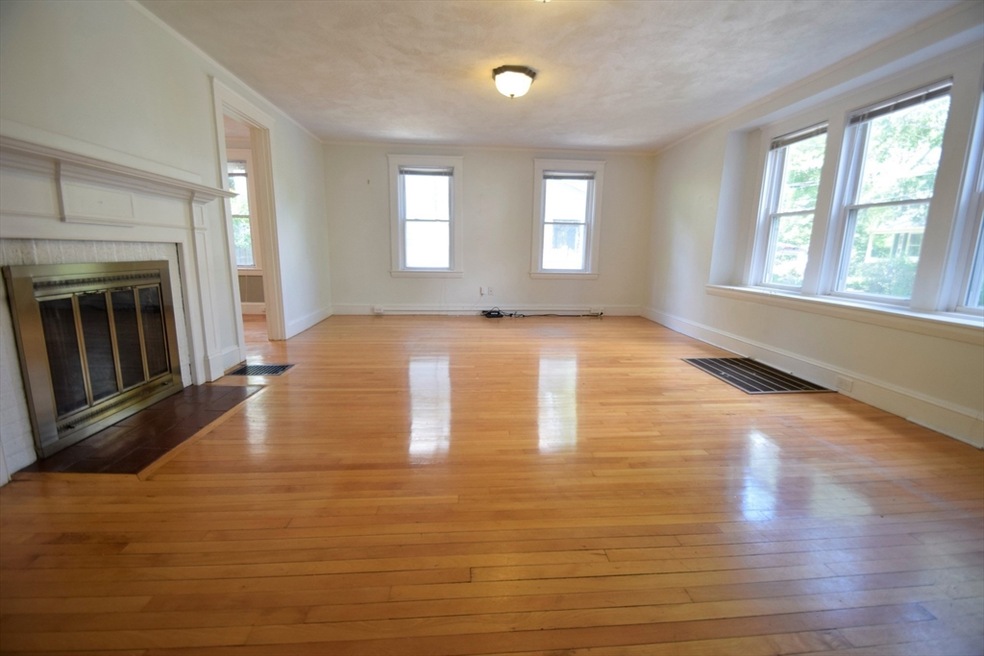
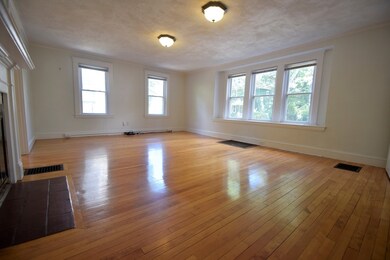
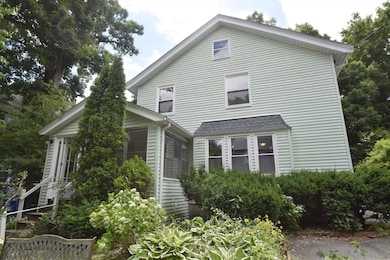
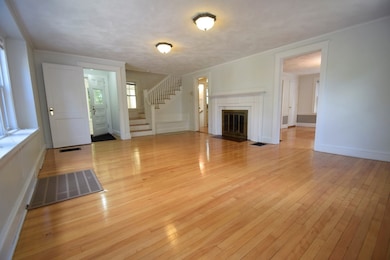
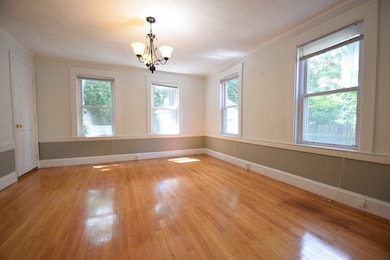
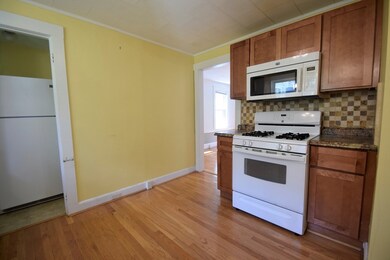
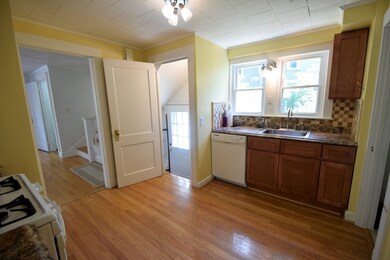
Single family house in sought after Newton Highlands neighborhood. Short distance to the Green Line (D) and easy commute to Rt 9 and I95. First floor features a large and sunny living room, dining room, kitchen, bathroom and sun porch. Upstairs includes three big bedrooms and a modern bathroom. Additional living space in the basement with a bathroom, office, and laundry. Private yard. Driveway and detached garage. Available for immediate move in.
| Date | Buyer | Sale Price | Title Company |
|---|---|---|---|
| Tyagi Anjali A | -- | -- | |
| Singh Anjay K | $545,000 | -- |
| Date | Event | Price | List to Sale | Price per Sq Ft |
|---|---|---|---|---|
| 10/04/2024 10/04/24 | Rented | $4,750 | +5.6% | -- |
| 09/17/2024 09/17/24 | Price Changed | $4,500 | -5.3% | $3 / Sq Ft |
| 08/21/2024 08/21/24 | Price Changed | $4,750 | -4.0% | $3 / Sq Ft |
| 07/16/2024 07/16/24 | Price Changed | $4,950 | -5.7% | $3 / Sq Ft |
| 07/01/2024 07/01/24 | For Rent | $5,250 | +21.4% | -- |
| 03/09/2022 03/09/22 | Rented | $4,325 | +3.0% | -- |
| 03/07/2022 03/07/22 | Under Contract | -- | -- | -- |
| 02/15/2022 02/15/22 | For Rent | $4,200 | +7.7% | -- |
| 03/29/2021 03/29/21 | Rented | $3,900 | 0.0% | -- |
| 03/24/2021 03/24/21 | Under Contract | -- | -- | -- |
| 03/03/2021 03/03/21 | Price Changed | $3,900 | -2.5% | $2 / Sq Ft |
| 02/05/2021 02/05/21 | For Rent | $4,000 | -- | -- |
| Year | Tax Paid | Tax Assessment Tax Assessment Total Assessment is a certain percentage of the fair market value that is determined by local assessors to be the total taxable value of land and additions on the property. | Land | Improvement |
|---|---|---|---|---|
| 2025 | $8,980 | $916,300 | $845,500 | $70,800 |
| 2024 | $8,682 | $889,600 | $820,900 | $68,700 |
| 2023 | $8,155 | $801,100 | $613,200 | $187,900 |
| 2022 | $7,804 | $741,800 | $567,800 | $174,000 |
| 2021 | $7,530 | $699,800 | $535,700 | $164,100 |
| 2020 | $7,306 | $699,800 | $535,700 | $164,100 |
| 2019 | $7,100 | $679,400 | $520,100 | $159,300 |
| 2018 | $10,983 | $624,900 | $471,400 | $153,500 |
| 2017 | $10,657 | $589,500 | $444,700 | $144,800 |
| 2016 | $6,269 | $550,900 | $415,600 | $135,300 |
| 2015 | $5,978 | $514,900 | $388,400 | $126,500 |
Landlord's Agent in 2024
Brandon Muroff
Brandon Muroff
(617) 240-2007
37 Total Sales
B
Tenant's Agent in 2024
Brian Rice
Sagan Harborside Sotheby's International Realty
16 Total Sales
Seller's Agent in 2022
Marissa Jazmin
Compass
(617) 447-5656
18 Total Sales
Buyer's Agent in 2022
John Saleh
Centre Realty Group
(617) 775-0894
28 Total Sales
Source: MLS Property Information Network (MLS PIN)
MLS Number: 73259493
APN: NEWT-000052-000001-000012
Disclaimer: Certain information contained herein is derived from information provided by parties other than Homes.com. All information provided is deemed reliable, but is not guaranteed to be accurate and should be independently verified.
![]() The property listing data and information, or the Images, set forth herein were provided to MLS Property Information Network, Inc. from third party sources, including sellers, lessors and public records, and were compiled by MLS Property Information Network, Inc. The property listing data and information, and the Images, are for the personal, non-commercial use of consumers having a good faith interest in purchasing or leasing listed properties of the type displayed to them and may not be used for any purpose other than to identify prospective properties which such consumers may have a good faith interest in purchasing or leasing. MLS Property Information Network, Inc. and its subscribers disclaim any and all representations and warranties as to the accuracy of the property listing data and information, or as to the accuracy of any of the Images, set forth herein.
The property listing data and information, or the Images, set forth herein were provided to MLS Property Information Network, Inc. from third party sources, including sellers, lessors and public records, and were compiled by MLS Property Information Network, Inc. The property listing data and information, and the Images, are for the personal, non-commercial use of consumers having a good faith interest in purchasing or leasing listed properties of the type displayed to them and may not be used for any purpose other than to identify prospective properties which such consumers may have a good faith interest in purchasing or leasing. MLS Property Information Network, Inc. and its subscribers disclaim any and all representations and warranties as to the accuracy of the property listing data and information, or as to the accuracy of any of the Images, set forth herein.