Estimated Value: $992,000 - $1,341,000
2
Beds
4
Baths
1,733
Sq Ft
$689/Sq Ft
Est. Value
About This Home
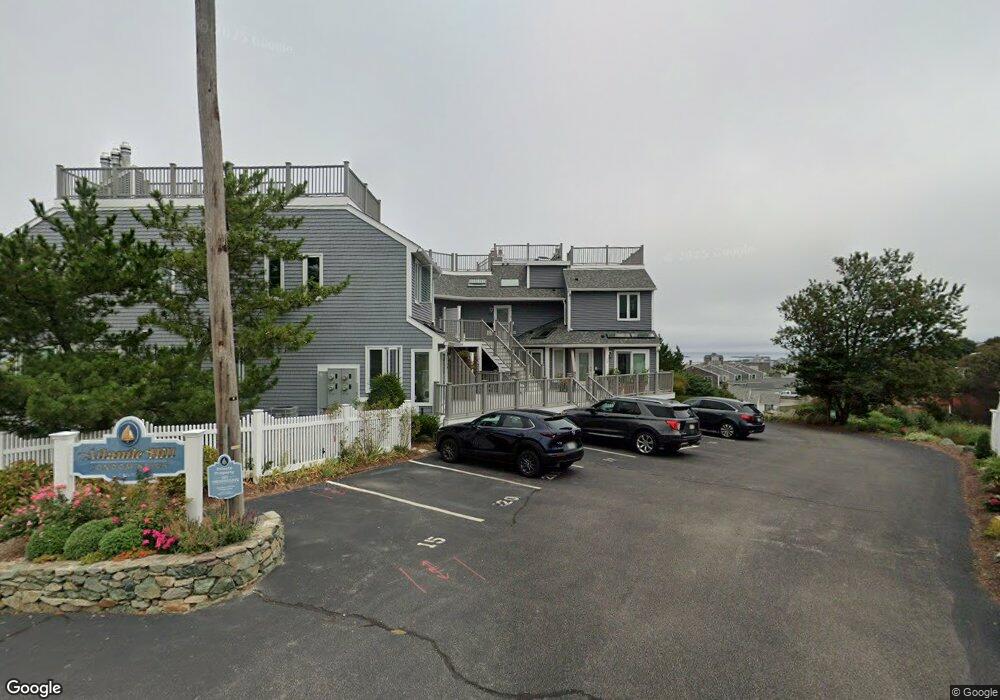
This home is located at 20 Oceanside Dr, Hull, MA 02045 and is currently estimated at $1,194,170, approximately $689 per square foot. 20 Oceanside Dr is a home located in Plymouth County with nearby schools including Lillian M. Jacobs Elementary School, Memorial Middle School, and Hull High School.
Ownership History
Date
Name
Owned For
Owner Type
Purchase Details
Closed on
Oct 27, 2022
Sold by
Roberts Eric and Gentile Kathryn
Bought by
Changeaux Kathy
Current Estimated Value
Purchase Details
Closed on
Sep 14, 2021
Sold by
Wilson Mark G
Bought by
Roberts Eric and Gentile Katheryn
Purchase Details
Closed on
Mar 3, 2016
Sold by
Buckley James L and Buckley Mary M
Bought by
Wilson Mark G
Home Financials for this Owner
Home Financials are based on the most recent Mortgage that was taken out on this home.
Original Mortgage
$355,500
Interest Rate
3.81%
Mortgage Type
New Conventional
Purchase Details
Closed on
Dec 11, 1992
Sold by
Fed Natl Mtg Assn
Bought by
Buckley James L and Buckley Mary M
Home Financials for this Owner
Home Financials are based on the most recent Mortgage that was taken out on this home.
Original Mortgage
$120,000
Interest Rate
8.16%
Mortgage Type
Purchase Money Mortgage
Create a Home Valuation Report for This Property
The Home Valuation Report is an in-depth analysis detailing your home's value as well as a comparison with similar homes in the area
Purchase History
| Date | Buyer | Sale Price | Title Company |
|---|---|---|---|
| Changeaux Kathy | $1,060,000 | None Available | |
| Roberts Eric | $700,000 | None Available | |
| Wilson Mark G | $395,000 | -- | |
| Buckley James L | $155,100 | -- |
Source: Public Records
Mortgage History
| Date | Status | Borrower | Loan Amount |
|---|---|---|---|
| Previous Owner | Wilson Mark G | $355,500 | |
| Previous Owner | Buckley James L | $120,000 |
Source: Public Records
Tax History
| Year | Tax Paid | Tax Assessment Tax Assessment Total Assessment is a certain percentage of the fair market value that is determined by local assessors to be the total taxable value of land and additions on the property. | Land | Improvement |
|---|---|---|---|---|
| 2025 | $13,072 | $1,167,100 | $0 | $1,167,100 |
| 2024 | $12,160 | $1,043,800 | $0 | $1,043,800 |
| 2023 | $9,653 | $793,200 | $0 | $793,200 |
| 2022 | $8,231 | $656,400 | $0 | $656,400 |
| 2021 | $7,863 | $620,100 | $0 | $620,100 |
| 2020 | $7,119 | $555,300 | $0 | $555,300 |
| 2019 | $7,247 | $555,300 | $0 | $555,300 |
| 2018 | $7,347 | $555,300 | $0 | $555,300 |
| 2017 | $7,347 | $535,500 | $0 | $535,500 |
| 2016 | $7,219 | $535,500 | $0 | $535,500 |
| 2015 | $6,620 | $474,900 | $0 | $474,900 |
| 2014 | $6,587 | $474,900 | $0 | $474,900 |
Source: Public Records
Map
Nearby Homes
- 6 State Park Rd Unit 2
- 62 Oceanside Dr
- 1 Longbeach Ave Unit 202
- 120 Nantasket Ave Unit 207
- 120 Nantasket Ave Unit 204
- 120 Nantasket Ave Unit 304
- 120 Nantasket Ave Unit PH5
- 120 Nantasket Ave Unit 201
- 121 Nantasket Ave Unit 503
- 99 Nantasket Ave
- 0 Seaview Ave
- 10 Berkley Rd Unit A
- 22 Berkley Rd Unit B
- 181 Atlantic Ave
- 6 Montana Ave
- 37 Richards Rd
- 23 Wyola Rd
- 155 George Washington Blvd Unit 210
- 2 Cliff Rd
- 10 Chestnut Place
- 24 Oceanside Dr
- 23 Oceanside Dr
- 22 Oceanside Dr
- 21 Oceanside Dr
- 19 Oceanside Dr
- 18 Oceanside Dr
- 17 Oceanside Dr
- 16 Oceanside Dr
- 15 Oceanside Dr
- 14 Oceanside Dr
- 13 Oceanside Dr
- 12 Oceanside Dr
- 11 Oceanside Dr
- 10 Oceanside Dr
- 9 Oceanside Dr
- 8 Oceanside Dr
- 7 Oceanside Dr
- 6 Oceanside Dr
- 5 Oceanside Dr
- 4 Oceanside Dr
Your Personal Tour Guide
Ask me questions while you tour the home.