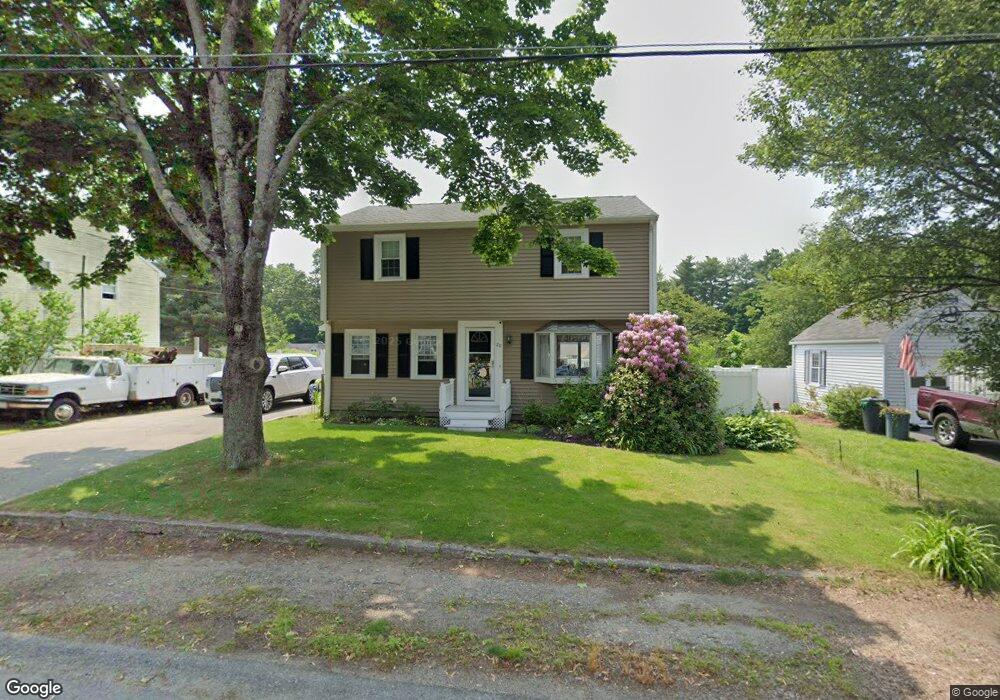
20 Oliver St West Bridgewater, MA 02379
Estimated Value: $497,507 - $585,000
4
Beds
2
Baths
1,772
Sq Ft
$306/Sq Ft
Est. Value
About This Home
This home is located at 20 Oliver St, West Bridgewater, MA 02379 and is currently estimated at $542,877, approximately $306 per square foot. 20 Oliver St is a home located in Plymouth County with nearby schools including Spring Street Elementary School, Howard Elementary School, and Rose L. MacDonald Elementary School.
Ownership History
Date
Name
Owned For
Owner Type
Purchase Details
Closed on
Oct 13, 1992
Sold by
Tribou Rlty Corp
Bought by
Graziano Francis A and Graziano Maureen M
Current Estimated Value
Purchase Details
Closed on
Sep 21, 1992
Sold by
Christian Charles I and Christian Ladonna L
Bought by
Belmont Rt
Purchase Details
Closed on
Jul 28, 1989
Sold by
Conlin John A
Bought by
Christian Charles I
Create a Home Valuation Report for This Property
The Home Valuation Report is an in-depth analysis detailing your home's value as well as a comparison with similar homes in the area
Home Values in the Area
Average Home Value in this Area
Purchase History
We collect this data history from publicly available records. To have your information removed, we recommend requesting removal directly through your county’s website.
| Date | Buyer | Sale Price | Title Company |
|---|---|---|---|
| Graziano Francis A | $115,000 | -- | |
| Belmont Rt | $83,000 | -- | |
| Christian Charles I | $175,000 | -- |
Source: Public Records
Mortgage History
We collect this data history from publicly available records. To have your information removed, we recommend requesting removal directly through your county’s website.
| Date | Status | Borrower | Loan Amount |
|---|---|---|---|
| Open | Christian Charles I | $148,900 | |
| Closed | Christian Charles I | $167,000 | |
| Closed | Christian Charles I | $158,000 |
Source: Public Records
Tax History
| Year | Tax Paid | Tax Assessment Tax Assessment Total Assessment is a certain percentage of the fair market value that is determined by local assessors to be the total taxable value of land and additions on the property. | Land | Improvement |
|---|---|---|---|---|
| 2025 | $5,603 | $409,900 | $197,600 | $212,300 |
| 2024 | $5,458 | $385,200 | $179,200 | $206,000 |
| 2023 | $5,095 | $331,500 | $155,100 | $176,400 |
| 2022 | $4,702 | $289,900 | $145,900 | $144,000 |
| 2021 | $4,625 | $276,800 | $145,900 | $130,900 |
| 2020 | $4,531 | $276,800 | $145,900 | $130,900 |
| 2019 | $4,490 | $271,600 | $145,900 | $125,700 |
| 2018 | $9,843 | $252,200 | $138,500 | $113,700 |
| 2017 | $4,174 | $235,400 | $125,600 | $109,800 |
| 2016 | $4,077 | $226,500 | $116,700 | $109,800 |
| 2015 | $3,918 | $220,000 | $116,700 | $103,300 |
| 2014 | $3,606 | $218,700 | $116,700 | $102,000 |
Source: Public Records
Map
Nearby Homes
- Lot 1 Jeffrey Ln
- lot 4 Jeffrey Ln
- 39 Friendship Dr
- 14 Fieldstone Terrace
- 16 Jason Way
- 30 Grant St
- 789 N Main St
- 4 Fairway Dr
- 516 Copeland St
- 31 Captain Carlson Way Unit 31
- 85 Crescent St
- 10 Charles St
- 9 Longworth Ave Unit 113
- 455 East St
- 15 Longworth Ave Unit 226
- 35 Longworth Ave Unit 25
- 35 Longworth Ave Unit 12
- 121 Prospect St
- 492 N Central St
- 452 N Central St
Your Personal Tour Guide
Ask me questions while you tour the home.