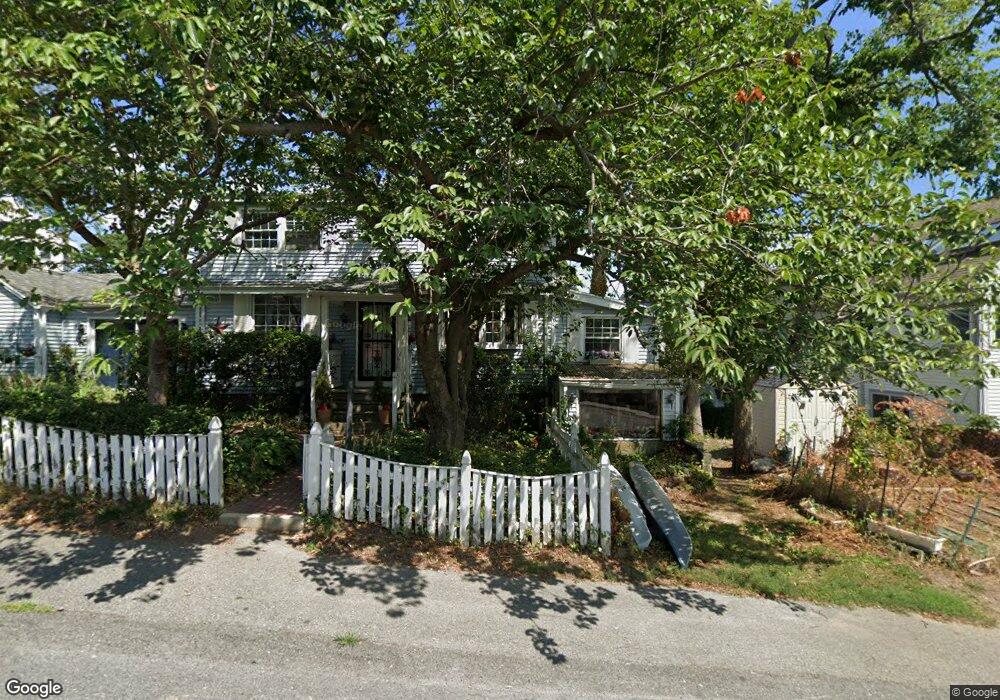
20 Orchard St Quincy, MA 02171
Squantum NeighborhoodEstimated Value: $620,000 - $841,000
3
Beds
1
Bath
1,434
Sq Ft
$497/Sq Ft
Est. Value
About This Home
This home is located at 20 Orchard St, Quincy, MA 02171 and is currently estimated at $712,413, approximately $496 per square foot. 20 Orchard St is a home located in Norfolk County with nearby schools including Squantum Elementary School, Atlantic Middle School, and North Quincy High School.
Ownership History
Date
Name
Owned For
Owner Type
Purchase Details
Closed on
Nov 23, 2023
Sold by
18 Orchard Street Rt and Lynch
Bought by
Tower Louis M
Current Estimated Value
Purchase Details
Closed on
Apr 27, 2021
Sold by
Tower Louis M and Tower Mary A
Bought by
18 Orchard Street Rt and Lynch
Create a Home Valuation Report for This Property
The Home Valuation Report is an in-depth analysis detailing your home's value as well as a comparison with similar homes in the area
Home Values in the Area
Average Home Value in this Area
Purchase History
| Date | Buyer | Sale Price | Title Company |
|---|---|---|---|
| Tower Louis M | -- | None Available | |
| Tower Louis M | -- | None Available | |
| 18 Orchard Street Rt | -- | None Available | |
| 18 Orchard Street Rt | -- | None Available |
Source: Public Records
Tax History
| Year | Tax Paid | Tax Assessment Tax Assessment Total Assessment is a certain percentage of the fair market value that is determined by local assessors to be the total taxable value of land and additions on the property. | Land | Improvement |
|---|---|---|---|---|
| 2025 | $7,899 | $685,100 | $429,700 | $255,400 |
| 2024 | $8,012 | $710,900 | $409,200 | $301,700 |
| 2023 | $7,649 | $687,200 | $389,700 | $297,500 |
| 2022 | $7,579 | $632,600 | $340,200 | $292,400 |
| 2021 | $7,495 | $617,400 | $340,200 | $277,200 |
| 2020 | $7,274 | $585,200 | $309,300 | $275,900 |
| 2019 | $7,097 | $565,500 | $323,400 | $242,100 |
| 2018 | $7,385 | $553,600 | $321,300 | $232,300 |
| 2017 | $6,072 | $428,500 | $232,800 | $195,700 |
| 2016 | $5,636 | $392,500 | $211,700 | $180,800 |
| 2015 | $5,506 | $377,100 | $211,700 | $165,400 |
| 2014 | $5,284 | $355,600 | $211,700 | $143,900 |
Source: Public Records
Map
Nearby Homes
- 156 Parke Ave
- 130 Parke Ave (Lot 2)
- 865 E Squantum St
- 1 Parke Ave
- 19 Harbourside Rd Unit 19
- 21 Harbourside Rd Unit 26
- 1001 Marina Dr Unit 705
- 1001 Marina Dr Unit 708
- 1001 Marina Dr Unit 213
- 100 Marina Dr Unit 615
- 100 Marina Dr Unit 306
- 2001 Marina Dr Unit 506W
- 2001 Marina Dr Unit 211
- 10 Seaport Dr Unit 2505
- 10 Seaport Dr Unit 2311
- 10 Seaport Dr Unit 2213
- 297 Billings St
- 271 Atlantic St
- 212 Quincy Shore Dr
- 201 Billings St
- 33 Brunswick St
- 14 Orchard St
- 24 Orchard St
- 41 Brunswick St
- 19 Orchard St
- 15 Orchard St
- 15 Orchard St
- 143 Bayside Rd
- 21 Orchard St
- 45 Brunswick St
- 11 Orchard St
- 36 Brunswick St
- 36 Brunswick St
- 32 Brunswick St
- 32 Brunswick St Unit 32
- 145 Bayside Rd Unit 1
- 145 Bayside Rd
- 42 Brunswick St
- 42 Brunswick St Unit 1
- 7 Orchard St
Your Personal Tour Guide
Ask me questions while you tour the home.