Estimated Value: $551,000 - $611,000
3
Beds
2
Baths
1,184
Sq Ft
$495/Sq Ft
Est. Value
About This Home
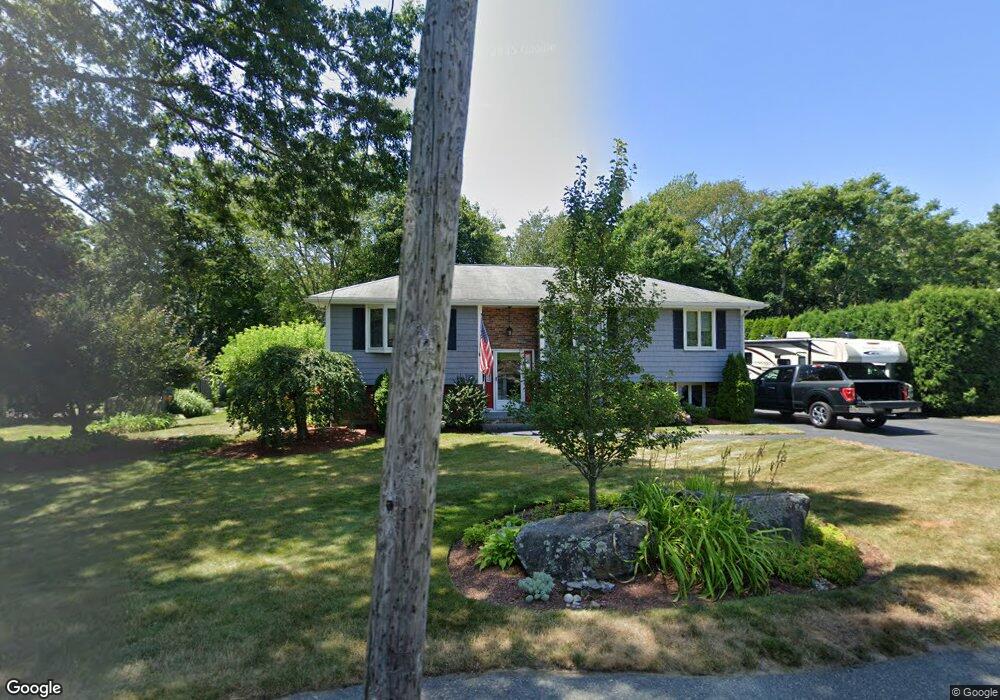
This home is located at 20 Page St, Avon, MA 02322 and is currently estimated at $586,290, approximately $495 per square foot. 20 Page St is a home located in Norfolk County with nearby schools including Ralph D. Butler Elementary School and Avon Middle/High School.
Ownership History
Date
Name
Owned For
Owner Type
Purchase Details
Closed on
Nov 1, 1996
Sold by
Goldberg Marilyn
Bought by
Fitzsimmons David and Fitzsimmons Susan M
Current Estimated Value
Home Financials for this Owner
Home Financials are based on the most recent Mortgage that was taken out on this home.
Original Mortgage
$137,700
Interest Rate
8.07%
Mortgage Type
Purchase Money Mortgage
Create a Home Valuation Report for This Property
The Home Valuation Report is an in-depth analysis detailing your home's value as well as a comparison with similar homes in the area
Home Values in the Area
Average Home Value in this Area
Purchase History
| Date | Buyer | Sale Price | Title Company |
|---|---|---|---|
| Fitzsimmons David | $153,000 | -- |
Source: Public Records
Mortgage History
| Date | Status | Borrower | Loan Amount |
|---|---|---|---|
| Open | Fitzsimmons David | $10,000 | |
| Open | Fitzsimmons David | $133,700 | |
| Closed | Fitzsimmons David | $137,700 |
Source: Public Records
Tax History Compared to Growth
Tax History
| Year | Tax Paid | Tax Assessment Tax Assessment Total Assessment is a certain percentage of the fair market value that is determined by local assessors to be the total taxable value of land and additions on the property. | Land | Improvement |
|---|---|---|---|---|
| 2025 | $66 | $497,400 | $190,100 | $307,300 |
| 2024 | $6,170 | $439,800 | $180,200 | $259,600 |
| 2023 | $5,990 | $439,800 | $180,200 | $259,600 |
| 2022 | $6,343 | $401,200 | $150,300 | $250,900 |
| 2021 | $6,011 | $358,200 | $136,200 | $222,000 |
| 2020 | $5,634 | $318,300 | $133,700 | $184,600 |
| 2019 | $5,559 | $309,000 | $133,700 | $175,300 |
| 2018 | $5,847 | $315,200 | $133,700 | $181,500 |
| 2017 | $4,780 | $276,600 | $133,700 | $142,900 |
| 2016 | $5,280 | $308,600 | $133,700 | $174,900 |
| 2015 | $4,728 | $288,800 | $121,500 | $167,300 |
Source: Public Records
Map
Nearby Homes