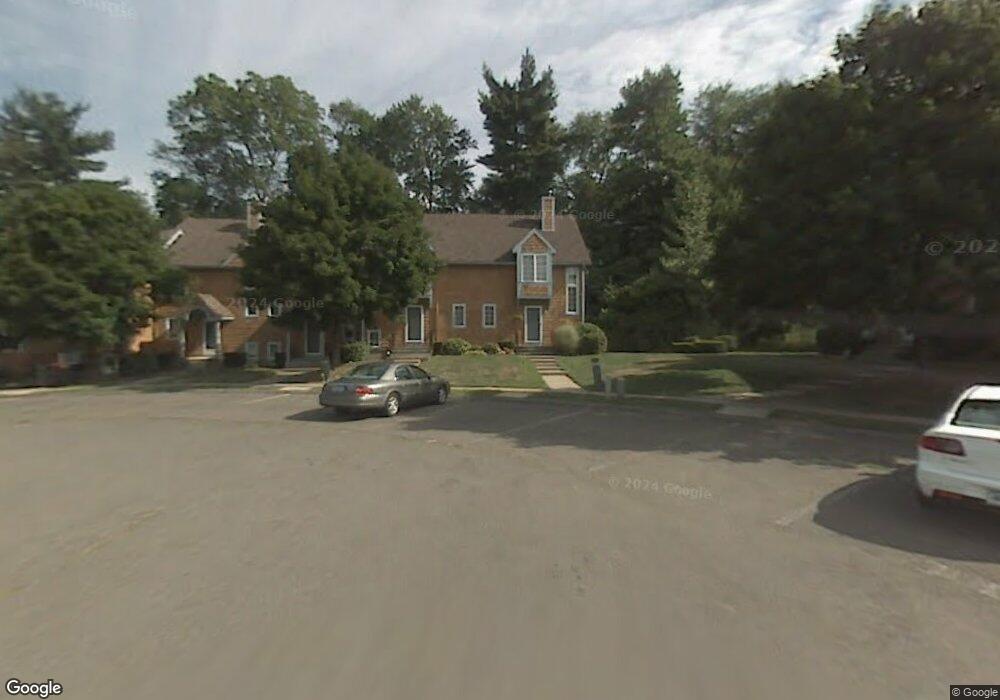
20 Pamela Ct Broad Brook, CT 06016
Estimated Value: $233,000 - $250,000
2
Beds
2
Baths
1,109
Sq Ft
$218/Sq Ft
Est. Value
About This Home
This home is located at 20 Pamela Ct, Broad Brook, CT 06016 and is currently estimated at $242,061, approximately $218 per square foot. 20 Pamela Ct is a home located in Hartford County with nearby schools including Broad Brook Elementary School, East Windsor Middle School, and East Windsor High School.
Ownership History
Date
Name
Owned For
Owner Type
Purchase Details
Closed on
Mar 11, 2020
Sold by
Bodeur Cynthia
Bought by
Kopacz Anthony and Rosenback Kayla
Current Estimated Value
Home Financials for this Owner
Home Financials are based on the most recent Mortgage that was taken out on this home.
Original Mortgage
$116,000
Outstanding Balance
$102,735
Interest Rate
3.5%
Mortgage Type
Purchase Money Mortgage
Estimated Equity
$139,326
Purchase Details
Closed on
Mar 19, 2015
Sold by
August Steven W
Bought by
Bodeur Cynthia J
Home Financials for this Owner
Home Financials are based on the most recent Mortgage that was taken out on this home.
Original Mortgage
$120,600
Interest Rate
3.6%
Mortgage Type
New Conventional
Purchase Details
Closed on
Dec 3, 2001
Sold by
Alaska Seaboard Prtnrs
Bought by
Cohen Glenn and Barber Kelley
Home Financials for this Owner
Home Financials are based on the most recent Mortgage that was taken out on this home.
Original Mortgage
$65,600
Interest Rate
6.66%
Create a Home Valuation Report for This Property
The Home Valuation Report is an in-depth analysis detailing your home's value as well as a comparison with similar homes in the area
Home Values in the Area
Average Home Value in this Area
Purchase History
| Date | Buyer | Sale Price | Title Company |
|---|---|---|---|
| Kopacz Anthony | $145,000 | None Available | |
| Bodeur Cynthia J | $134,000 | -- | |
| Cohen Glenn | $72,900 | -- |
Source: Public Records
Mortgage History
| Date | Status | Borrower | Loan Amount |
|---|---|---|---|
| Open | Kopacz Anthony | $116,000 | |
| Previous Owner | Cohen Glenn | $120,600 | |
| Previous Owner | Cohen Glenn | $109,000 | |
| Previous Owner | Cohen Glenn | $56,000 | |
| Previous Owner | Cohen Glenn | $65,600 |
Source: Public Records
Tax History
| Year | Tax Paid | Tax Assessment Tax Assessment Total Assessment is a certain percentage of the fair market value that is determined by local assessors to be the total taxable value of land and additions on the property. | Land | Improvement |
|---|---|---|---|---|
| 2025 | $3,618 | $136,590 | $0 | $136,590 |
| 2024 | $3,355 | $136,590 | $0 | $136,590 |
| 2023 | $3,129 | $91,280 | $0 | $91,280 |
| 2022 | $1,042 | $91,280 | $0 | $91,280 |
| 2021 | $3,149 | $91,280 | $0 | $91,280 |
| 2020 | $3,169 | $91,280 | $0 | $91,280 |
| 2019 | $3,126 | $91,280 | $0 | $91,280 |
| 2018 | $3,094 | $91,280 | $0 | $91,280 |
| 2017 | $3,092 | $94,350 | $0 | $94,350 |
| 2016 | $2,918 | $94,350 | $0 | $94,350 |
| 2015 | $2,860 | $94,350 | $0 | $94,350 |
| 2014 | $2,810 | $94,350 | $0 | $94,350 |
Source: Public Records
Map
Nearby Homes
- 4 Rye St
- 111 Old Ellington Rd
- 13 Reservoir Ave
- 33 Harrington Rd
- 28 Mahoney Rd
- 26 Hillside Farms Dr
- 0 Wells Rd
- 30 Broadbrook Rd
- 193 Wells Rd
- 0 Chamberlain Rd Unit 24154561
- 20 Apothecaries Hall Rd
- 102 Scantic Rd
- 160 East Rd
- 164 East Rd
- 183 Chamberlain Rd
- 0 Ellsworth Rd
- 77 Thrall Rd
- 0 Thrall Rd Unit 24150600
- 29 Eastgate Ln
- 89 Steele Rd
- 20 Pamela Ct Unit 20
- 18 Pamela Ct
- 18 Pamela Ct Unit 18
- 22 Pamela Ct
- 22 Pamela Ct Unit 22
- 24 Pamela Ct
- 24 Pamela Ct Unit 24
- 14 Pamela Ct
- 26 Pamela Ct
- 28 Pamela Ct
- 28 Pamela Ct Unit 28
- 12 Pamela Ct
- 10 Pamela Ct
- 10 Pamela Ct Unit 10
- 30 Pamela Ct
- 30 Pamela Ct Unit 30
- 8 Pamela Ct
- 32 Pamela Ct
- 6 Pamela Ct
- 34 Pamela Ct
Your Personal Tour Guide
Ask me questions while you tour the home.