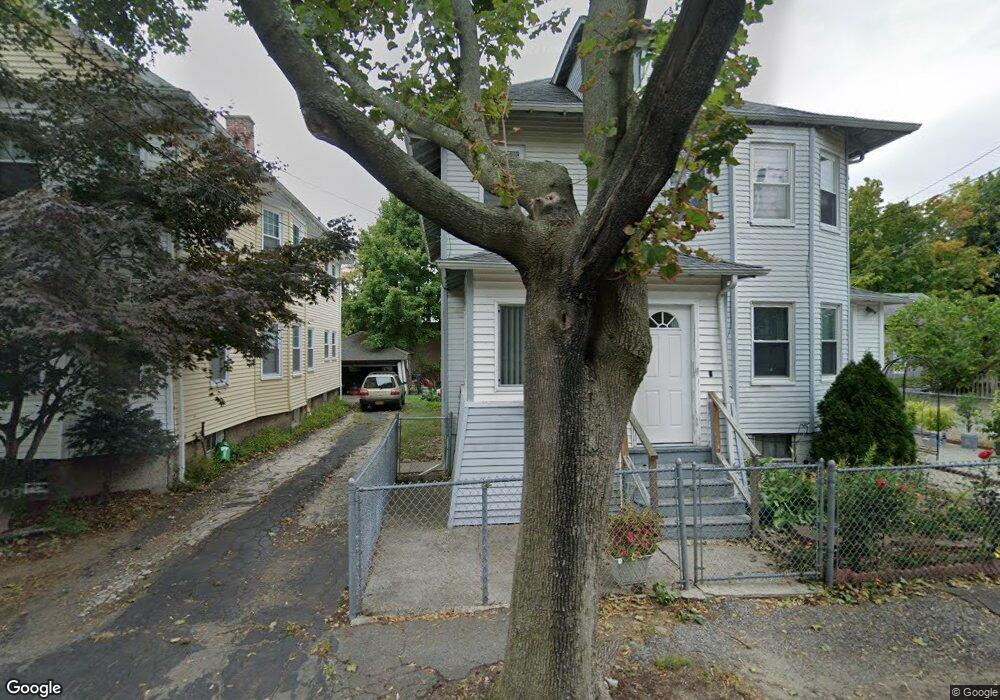
20 Park St Unit 22 Waltham, MA 02453
Angleside NeighborhoodEstimated Value: $972,000 - $1,100,000
2
Beds
3
Baths
2,404
Sq Ft
$423/Sq Ft
Est. Value
About This Home
This home is located at 20 Park St Unit 22, Waltham, MA 02453 and is currently estimated at $1,016,792, approximately $422 per square foot. 20 Park St Unit 22 is a home located in Middlesex County with nearby schools including Henry Whittemore Elementary School, John W. Mcdevitt Middle School, and Waltham Sr High School.
Ownership History
Date
Name
Owned For
Owner Type
Purchase Details
Closed on
Aug 16, 2021
Sold by
Chow-Bakalis Alison and Bakalis Albert D
Bought by
Chow Natalie and Chow Shane
Current Estimated Value
Purchase Details
Closed on
Jun 29, 2018
Sold by
Chow-Bakalis Alison and Chow Paw
Bought by
Chow-Bakalis Alison
Home Financials for this Owner
Home Financials are based on the most recent Mortgage that was taken out on this home.
Original Mortgage
$325,000
Interest Rate
4.6%
Mortgage Type
New Conventional
Purchase Details
Closed on
Feb 3, 1993
Sold by
Gossios Athanassios and Gossios Marianthi
Bought by
Chow Wain Fee
Home Financials for this Owner
Home Financials are based on the most recent Mortgage that was taken out on this home.
Original Mortgage
$100,000
Interest Rate
8.1%
Mortgage Type
Purchase Money Mortgage
Create a Home Valuation Report for This Property
The Home Valuation Report is an in-depth analysis detailing your home's value as well as a comparison with similar homes in the area
Home Values in the Area
Average Home Value in this Area
Purchase History
| Date | Buyer | Sale Price | Title Company |
|---|---|---|---|
| Chow Natalie | -- | None Available | |
| Chow-Bakalis Alison | $680,000 | -- | |
| Chow Wain Fee | $180,000 | -- |
Source: Public Records
Mortgage History
| Date | Status | Borrower | Loan Amount |
|---|---|---|---|
| Previous Owner | Chow-Bakalis Alison | $325,000 | |
| Previous Owner | Chow Wain Fee | $100,000 | |
| Previous Owner | Chow Wain Fee | $140,000 |
Source: Public Records
Tax History Compared to Growth
Tax History
| Year | Tax Paid | Tax Assessment Tax Assessment Total Assessment is a certain percentage of the fair market value that is determined by local assessors to be the total taxable value of land and additions on the property. | Land | Improvement |
|---|---|---|---|---|
| 2025 | $8,219 | $837,000 | $348,200 | $488,800 |
| 2024 | $7,599 | $788,300 | $348,200 | $440,100 |
| 2023 | $7,652 | $741,500 | $317,200 | $424,300 |
| 2022 | $7,755 | $696,100 | $289,600 | $406,500 |
| 2021 | $7,333 | $647,800 | $262,000 | $385,800 |
| 2020 | $7,263 | $607,800 | $248,200 | $359,600 |
| 2019 | $6,803 | $537,400 | $245,800 | $291,600 |
| 2018 | $6,142 | $487,100 | $227,600 | $259,500 |
| 2017 | $5,858 | $466,400 | $206,900 | $259,500 |
| 2016 | $5,413 | $442,200 | $182,700 | $259,500 |
| 2015 | $5,177 | $394,300 | $179,300 | $215,000 |
Source: Public Records
Map
Nearby Homes
- 73 Orange St Unit 2
- 101-103 Lexington St
- 11 Derby St
- 49 Staniford St
- 31-37 Washington Ave
- 265-267 River St Unit 267
- 265-267 River St Unit 265
- 24 Tolman St Unit A
- 160 Pine St Unit 12
- 15 Alder St Unit 1
- 47 Alder St Unit 6
- 40 Myrtle St Unit 9
- 42 Alder St
- 90 Auburndale Ave
- 56 Dearborn St
- 81 Alder St
- 44 Westland Ave
- 85 Crescent St
- 61 Hall St Unit 1
- 61 Hall St Unit 9
- 16-18 Park St Unit 16
- 16-18 Park St Unit 18
- 16 Park St Unit 18
- 18 Park St
- 12 Park St Unit 14
- 12 Park St Unit 3
- 12 Park St Unit 2
- 12 Park St Unit 1
- 12-14 Park St
- 14 Park St
- 26 Park St
- 10 Park St
- 30 Park St
- 30 Park St Unit 30
- 12 Martyn St
- 23 Rumford Ave Unit 25
- 23 Rumford Ave Unit 1
- 34 Park St
- 33 Rumford Ave
- 25 Rumford Ave Unit 2