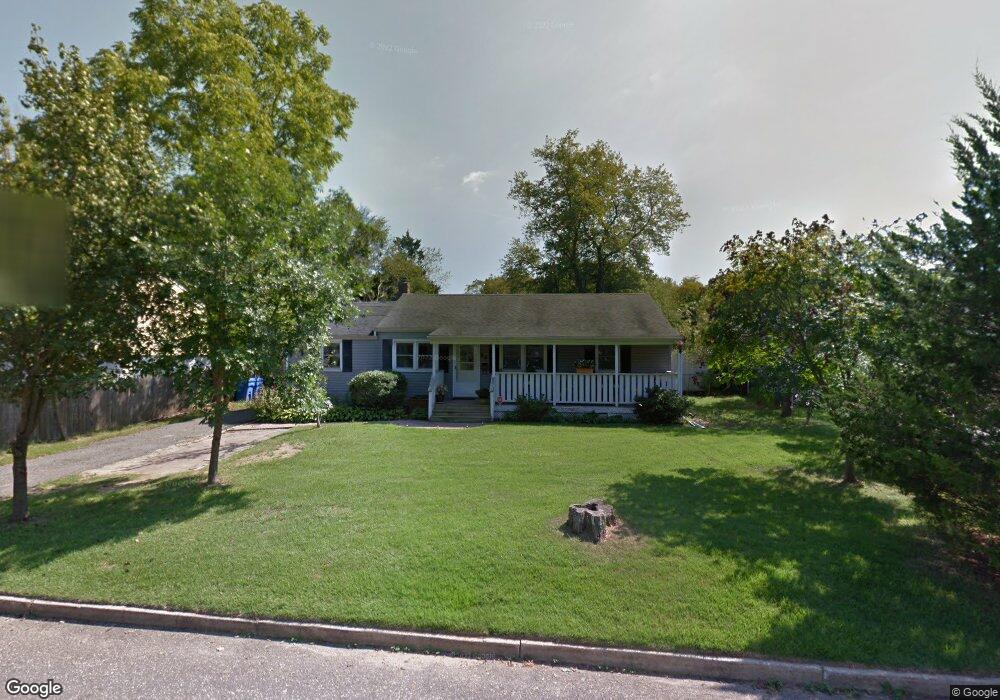
20 Pear St Tinton Falls, NJ 07724
Estimated Value: $553,000 - $625,000
3
Beds
1
Bath
1,690
Sq Ft
$349/Sq Ft
Est. Value
About This Home
This home is located at 20 Pear St, Tinton Falls, NJ 07724 and is currently estimated at $589,517, approximately $348 per square foot. 20 Pear St is a home located in Monmouth County with nearby schools including Mahala F. Atchinson Elementary School, Swimming River Elementary School, and Tinton Falls Middle School.
Ownership History
Date
Name
Owned For
Owner Type
Purchase Details
Closed on
Aug 31, 2020
Sold by
Kalla Giriga Naga Praveen and Kalla Naga Praveen
Bought by
Kalla Giriga Naga Praveen and Pacholy Nishita
Current Estimated Value
Home Financials for this Owner
Home Financials are based on the most recent Mortgage that was taken out on this home.
Original Mortgage
$171,750
Outstanding Balance
$118,808
Interest Rate
2.9%
Mortgage Type
New Conventional
Estimated Equity
$470,709
Purchase Details
Closed on
Jun 25, 2007
Sold by
Le Long N
Bought by
Kalla Naga Praveen
Home Financials for this Owner
Home Financials are based on the most recent Mortgage that was taken out on this home.
Original Mortgage
$280,000
Interest Rate
6.62%
Mortgage Type
Purchase Money Mortgage
Purchase Details
Closed on
Nov 7, 2006
Sold by
Rocheford Glenn
Bought by
Le Long N
Home Financials for this Owner
Home Financials are based on the most recent Mortgage that was taken out on this home.
Original Mortgage
$185,566
Interest Rate
6.39%
Mortgage Type
Purchase Money Mortgage
Create a Home Valuation Report for This Property
The Home Valuation Report is an in-depth analysis detailing your home's value as well as a comparison with similar homes in the area
Home Values in the Area
Average Home Value in this Area
Purchase History
| Date | Buyer | Sale Price | Title Company |
|---|---|---|---|
| Kalla Giriga Naga Praveen | -- | Amrock Llc | |
| Kalla Naga Praveen | $350,000 | Scott Title Services Llc | |
| Le Long N | $247,422 | -- |
Source: Public Records
Mortgage History
| Date | Status | Borrower | Loan Amount |
|---|---|---|---|
| Open | Kalla Giriga Naga Praveen | $171,750 | |
| Closed | Kalla Naga Praveen | $280,000 | |
| Previous Owner | Le Long N | $185,566 |
Source: Public Records
Tax History Compared to Growth
Tax History
| Year | Tax Paid | Tax Assessment Tax Assessment Total Assessment is a certain percentage of the fair market value that is determined by local assessors to be the total taxable value of land and additions on the property. | Land | Improvement |
|---|---|---|---|---|
| 2025 | $7,043 | $540,600 | $295,000 | $245,600 |
| 2024 | $6,444 | $484,400 | $244,400 | $240,000 |
| 2023 | $6,444 | $419,000 | $183,600 | $235,400 |
| 2022 | $5,929 | $370,800 | $146,600 | $224,200 |
| 2021 | $5,894 | $306,100 | $125,900 | $180,200 |
| 2020 | $6,007 | $299,600 | $123,500 | $176,100 |
| 2019 | $5,894 | $294,700 | $119,600 | $175,100 |
| 2018 | $5,860 | $292,400 | $125,500 | $166,900 |
| 2017 | $5,314 | $258,700 | $123,500 | $135,200 |
| 2016 | $5,048 | $240,600 | $125,500 | $115,100 |
| 2015 | $4,590 | $203,400 | $109,200 | $94,200 |
| 2014 | $4,939 | $227,200 | $109,200 | $118,000 |
Source: Public Records
Map
Nearby Homes
- 125 Springdale Ave
- 56 Plum St
- 8 Glenwood Dr
- 10 Hance Ave
- 54 Steven Ave
- 11 Clifford Graves Ct
- 49 Sunset Ave W
- 44 Sunset Ave W
- 19 Sunset Ave E
- 44 Drummond Ave
- 167 River St
- 39 Sunset Ave E
- 55 Spruce Dr
- 121 Catherine St
- 712 Sycamore Ave
- 74 Leighton Ave
- 834 Sycamore Ave
- 3 Cedar Crossing
- 24 Cedar Crossing
- 15 Hillside St