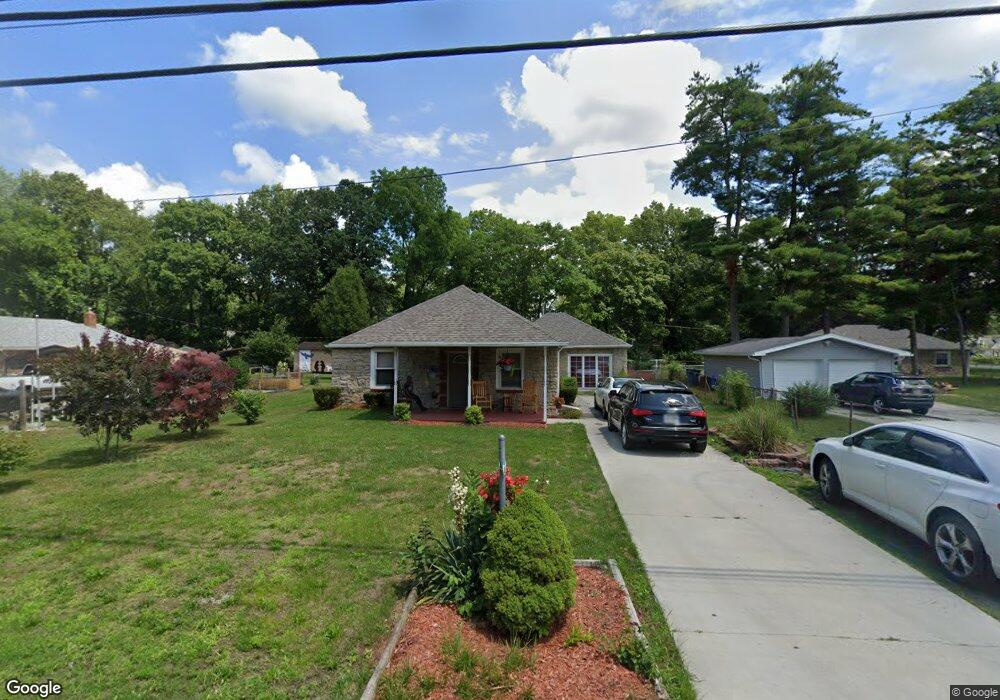
20 Perrine St Holland, OH 43528
Estimated Value: $136,000 - $237,000
3
Beds
1
Bath
1,590
Sq Ft
$116/Sq Ft
Est. Value
About This Home
This home is located at 20 Perrine St, Holland, OH 43528 and is currently estimated at $184,550, approximately $116 per square foot. 20 Perrine St is a home located in Lucas County with nearby schools including Dorr Street Elementary School, Springfield Middle School, and Springfield High School.
Ownership History
Date
Name
Owned For
Owner Type
Purchase Details
Closed on
Jan 12, 2011
Sold by
Fannie Mae
Bought by
Lama Oussama
Current Estimated Value
Purchase Details
Closed on
Apr 15, 2010
Sold by
Lindhurst Larry C and Lindhurst Monica S
Bought by
Federal National Mortgage Association
Purchase Details
Closed on
Feb 12, 2003
Sold by
Gail Schramm and Kidwell Gail
Bought by
Lindhurst Larry C and Lindhurst Monica S
Home Financials for this Owner
Home Financials are based on the most recent Mortgage that was taken out on this home.
Original Mortgage
$90,100
Interest Rate
5.94%
Purchase Details
Closed on
Jan 8, 1999
Sold by
Schramm Gail and Kidwell Gail
Bought by
Lindhurst Larry C
Home Financials for this Owner
Home Financials are based on the most recent Mortgage that was taken out on this home.
Original Mortgage
$57,500
Interest Rate
6.83%
Mortgage Type
Seller Take Back
Create a Home Valuation Report for This Property
The Home Valuation Report is an in-depth analysis detailing your home's value as well as a comparison with similar homes in the area
Home Values in the Area
Average Home Value in this Area
Purchase History
| Date | Buyer | Sale Price | Title Company |
|---|---|---|---|
| Lama Oussama | $34,900 | Accutitle Agency | |
| Federal National Mortgage Association | $76,667 | None Available | |
| Lindhurst Larry C | $65,000 | Barristers Title Agency | |
| Lindhurst Larry C | $65,000 | -- |
Source: Public Records
Mortgage History
| Date | Status | Borrower | Loan Amount |
|---|---|---|---|
| Previous Owner | Lindhurst Larry C | $90,100 | |
| Previous Owner | Lindhurst Larry C | $57,500 |
Source: Public Records
Tax History Compared to Growth
Tax History
| Year | Tax Paid | Tax Assessment Tax Assessment Total Assessment is a certain percentage of the fair market value that is determined by local assessors to be the total taxable value of land and additions on the property. | Land | Improvement |
|---|---|---|---|---|
| 2024 | $1,301 | $41,720 | $8,925 | $32,795 |
| 2023 | $1,106 | $14,980 | $7,245 | $7,735 |
| 2022 | $1,100 | $14,980 | $7,245 | $7,735 |
| 2021 | $1,038 | $14,980 | $7,245 | $7,735 |
| 2020 | $1,119 | $14,700 | $7,105 | $7,595 |
| 2019 | $1,094 | $14,700 | $7,105 | $7,595 |
| 2018 | $1,121 | $14,700 | $7,105 | $7,595 |
| 2017 | $1,155 | $14,560 | $5,810 | $8,750 |
| 2016 | $1,166 | $41,600 | $16,600 | $25,000 |
| 2015 | $1,164 | $41,600 | $16,600 | $25,000 |
| 2014 | $1,009 | $14,000 | $5,600 | $8,400 |
| 2013 | $1,009 | $14,000 | $5,600 | $8,400 |
Source: Public Records
Map
Nearby Homes
- 226 Perrine St
- 7238 Lilac Ct
- 134 Deerfield Dr
- 217 Pebble Beach Dr
- 7111 Nebraska Ave
- 617 & 621 S Mccord Rd
- 6855 Wharton Rd
- 127 N Dorcas Rd
- 319 S Mccord Rd
- 343 S Mccord Rd
- 6607 Hill Ave
- 508 Crystal Lake Dr
- 324 Harefoote St
- 7331 Witherby Ct
- 1053 Plum Grove Ln
- 6955 Dorr St
- 352 Cheswick St
- 7909 Hill Ave
- 426 Cheswick Rd
- 7944 Hill Ave