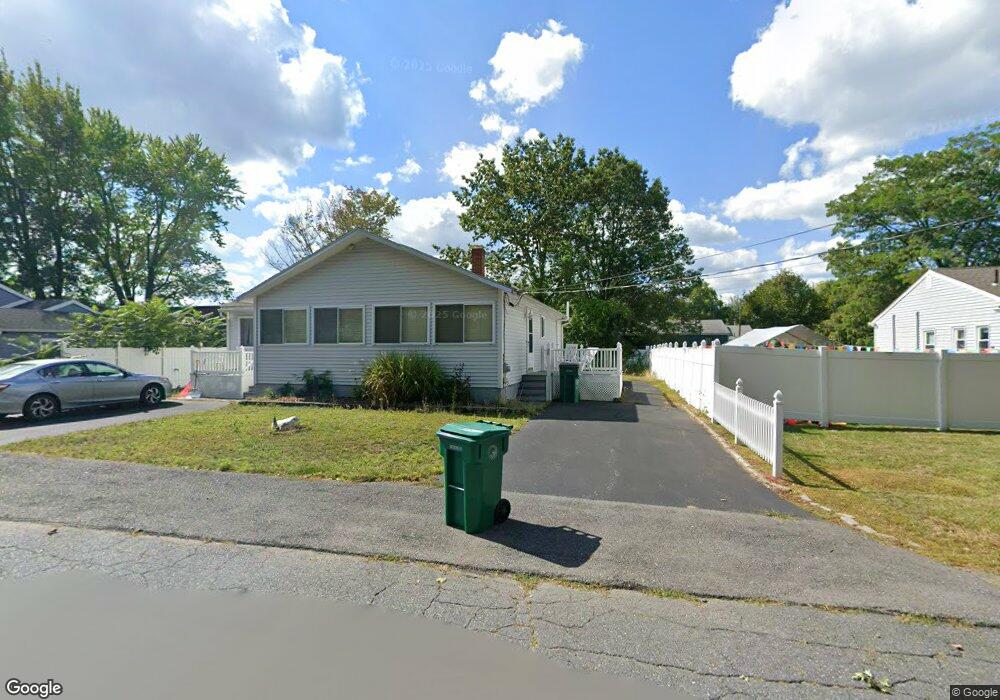
20 Proctor Ave Fitchburg, MA 01420
South Fitchburg NeighborhoodEstimated Value: $349,000 - $451,395
3
Beds
1
Bath
2,272
Sq Ft
$176/Sq Ft
Est. Value
About This Home
This home is located at 20 Proctor Ave, Fitchburg, MA 01420 and is currently estimated at $400,099, approximately $176 per square foot. 20 Proctor Ave is a home located in Worcester County with nearby schools including South Street Elementary School, Crocker Elementary School, and Reingold Elementary School.
Ownership History
Date
Name
Owned For
Owner Type
Purchase Details
Closed on
Oct 20, 2023
Sold by
Amidon Bruce L Est and Fateiger
Bought by
Amidon William H and Fateiger Dorothea
Current Estimated Value
Purchase Details
Closed on
Apr 22, 2021
Sold by
Amidon Ruby M Est and Fateiger
Bought by
Amidon Bruce L
Purchase Details
Closed on
Nov 23, 1987
Sold by
Cordio Richard R
Bought by
Amidon Ruby M
Home Financials for this Owner
Home Financials are based on the most recent Mortgage that was taken out on this home.
Original Mortgage
$22,000
Interest Rate
11.22%
Mortgage Type
Purchase Money Mortgage
Purchase Details
Closed on
Jun 9, 1987
Sold by
Cordio Louis R
Bought by
Cordio Richard R
Home Financials for this Owner
Home Financials are based on the most recent Mortgage that was taken out on this home.
Original Mortgage
$110,000
Interest Rate
10.38%
Mortgage Type
Purchase Money Mortgage
Create a Home Valuation Report for This Property
The Home Valuation Report is an in-depth analysis detailing your home's value as well as a comparison with similar homes in the area
Home Values in the Area
Average Home Value in this Area
Purchase History
| Date | Buyer | Sale Price | Title Company |
|---|---|---|---|
| Amidon William H | -- | None Available | |
| Amidon Bruce L | -- | None Available | |
| Amidon Ruby M | $125,000 | -- | |
| Cordio Richard R | $110,000 | -- |
Source: Public Records
Mortgage History
| Date | Status | Borrower | Loan Amount |
|---|---|---|---|
| Previous Owner | Cordio Richard R | $22,000 | |
| Previous Owner | Cordio Richard R | $110,000 |
Source: Public Records
Tax History Compared to Growth
Tax History
| Year | Tax Paid | Tax Assessment Tax Assessment Total Assessment is a certain percentage of the fair market value that is determined by local assessors to be the total taxable value of land and additions on the property. | Land | Improvement |
|---|---|---|---|---|
| 2025 | $52 | $382,900 | $97,800 | $285,100 |
| 2024 | $4,801 | $324,200 | $60,600 | $263,600 |
| 2023 | $4,687 | $292,600 | $52,100 | $240,500 |
| 2022 | $4,536 | $257,600 | $43,700 | $213,900 |
| 2021 | $4,388 | $230,600 | $31,500 | $199,100 |
| 2020 | $4,222 | $214,200 | $29,100 | $185,100 |
| 2019 | $3,877 | $189,200 | $38,800 | $150,400 |
| 2018 | $3,637 | $173,100 | $36,400 | $136,700 |
| 2017 | $3,434 | $159,800 | $32,700 | $127,100 |
| 2016 | $3,312 | $156,000 | $31,500 | $124,500 |
| 2015 | $3,168 | $153,200 | $30,300 | $122,900 |
| 2014 | $3,026 | $152,600 | $30,300 | $122,300 |
Source: Public Records
Map
Nearby Homes