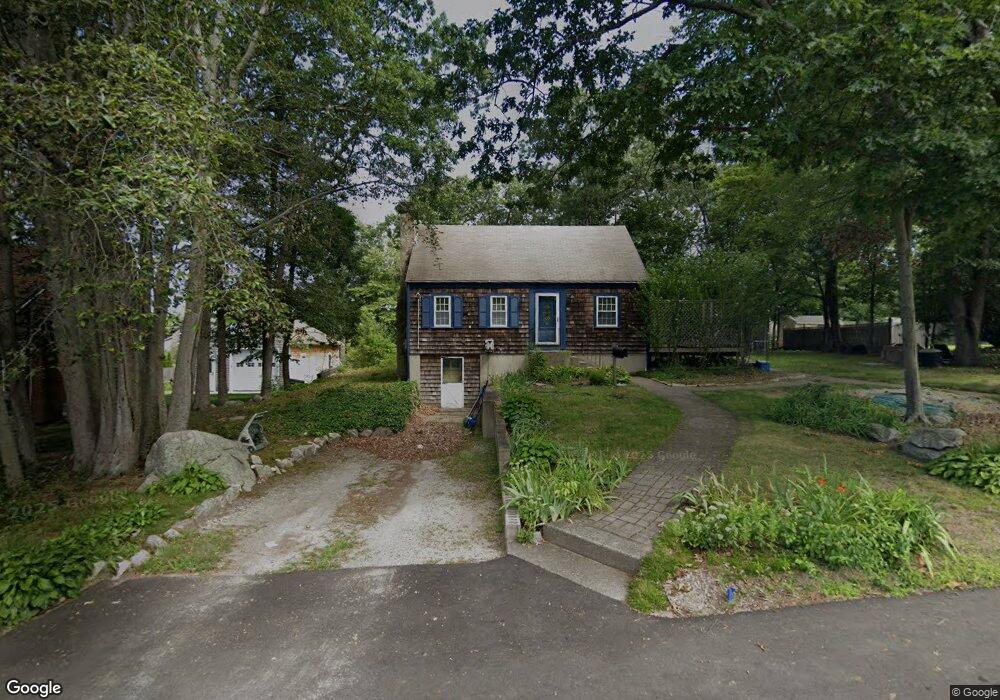
20 Progress St Weymouth, MA 02188
South Weymouth NeighborhoodEstimated Value: $616,000 - $788,000
5
Beds
3
Baths
2,464
Sq Ft
$288/Sq Ft
Est. Value
About This Home
This home is located at 20 Progress St, Weymouth, MA 02188 and is currently estimated at $708,517, approximately $287 per square foot. 20 Progress St is a home located in Norfolk County with nearby schools including Frederick C Murphy, Abigail Adams Middle School, and Weymouth Middle School Chapman.
Ownership History
Date
Name
Owned For
Owner Type
Purchase Details
Closed on
Dec 30, 1998
Sold by
Mckenna Robert A and Mckenna Susan E
Bought by
Graham Thomas J
Current Estimated Value
Home Financials for this Owner
Home Financials are based on the most recent Mortgage that was taken out on this home.
Original Mortgage
$154,700
Interest Rate
6.84%
Mortgage Type
Purchase Money Mortgage
Purchase Details
Closed on
Jun 3, 1996
Sold by
Mckenna John D and Mckenna Phyllis J
Bought by
Mckenna Robert A and Mckenna Susan E
Home Financials for this Owner
Home Financials are based on the most recent Mortgage that was taken out on this home.
Original Mortgage
$118,400
Interest Rate
7.91%
Mortgage Type
Purchase Money Mortgage
Create a Home Valuation Report for This Property
The Home Valuation Report is an in-depth analysis detailing your home's value as well as a comparison with similar homes in the area
Home Values in the Area
Average Home Value in this Area
Purchase History
| Date | Buyer | Sale Price | Title Company |
|---|---|---|---|
| Graham Thomas J | $162,900 | -- | |
| Mckenna Robert A | $148,000 | -- |
Source: Public Records
Mortgage History
| Date | Status | Borrower | Loan Amount |
|---|---|---|---|
| Open | Mckenna Robert A | $208,800 | |
| Closed | Mckenna Robert A | $56,000 | |
| Closed | Mckenna Robert A | $154,700 | |
| Previous Owner | Mckenna Robert A | $118,400 |
Source: Public Records
Tax History
| Year | Tax Paid | Tax Assessment Tax Assessment Total Assessment is a certain percentage of the fair market value that is determined by local assessors to be the total taxable value of land and additions on the property. | Land | Improvement |
|---|---|---|---|---|
| 2025 | $7,321 | $724,900 | $251,300 | $473,600 |
| 2024 | $7,162 | $697,400 | $239,300 | $458,100 |
| 2023 | $6,886 | $658,900 | $221,600 | $437,300 |
| 2022 | $6,483 | $565,700 | $188,100 | $377,600 |
| 2021 | $6,173 | $525,800 | $188,100 | $337,700 |
| 2020 | $6,005 | $503,800 | $188,100 | $315,700 |
| 2019 | $5,906 | $487,300 | $180,900 | $306,400 |
| 2018 | $5,704 | $456,300 | $172,200 | $284,100 |
| 2017 | $5,013 | $391,300 | $164,100 | $227,200 |
| 2016 | $4,593 | $358,800 | $157,800 | $201,000 |
| 2015 | $4,346 | $336,900 | $150,600 | $186,300 |
| 2014 | $4,143 | $311,500 | $140,100 | $171,400 |
Source: Public Records
Map
Nearby Homes
- 501 Commerce Dr Unit 2110
- 501 Commerce Dr Unit 4308
- 82 Lester Ln
- 73 Ryder Rd
- 300 West St
- 17 Berean Way
- 432 Grove St
- 33 Congress St
- 8 Tara Dr Unit 4
- 8 Tara Dr Unit 5
- 972 Liberty St
- 15 Summer St
- 31 Doris Rd
- 747 Middle St
- 2 Mitchell Ln Unit B
- 54 Old Quarry Dr
- 116 Greenvale Ave
- 19 Vine St Unit 2
- 426 John Mahar Hwy Unit 311
- 11 Richmond St
Your Personal Tour Guide
Ask me questions while you tour the home.