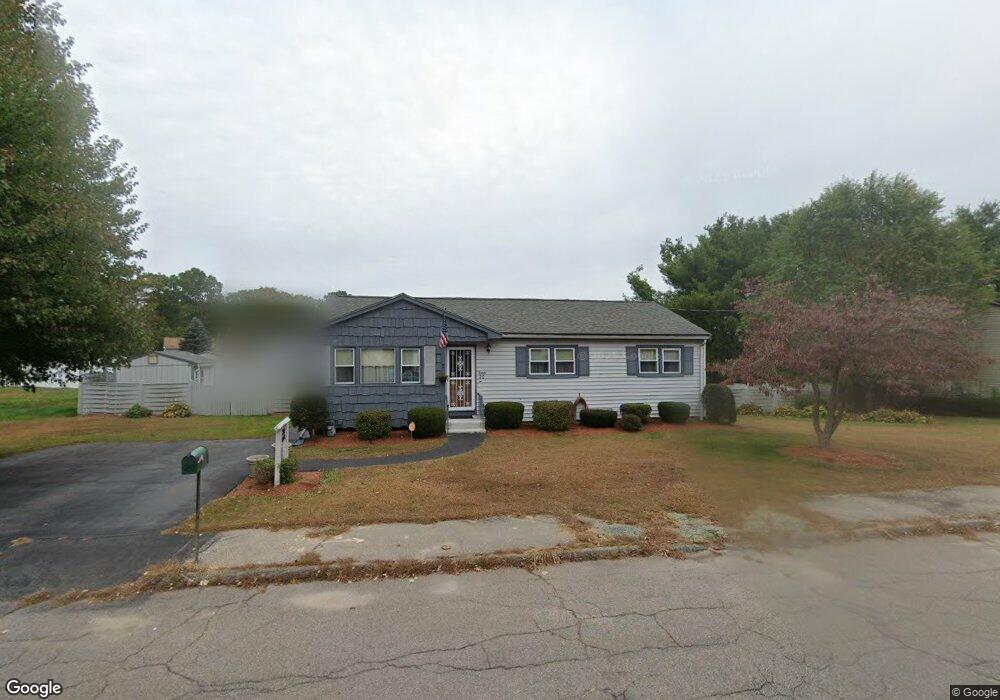
20 Quarry Rd Randolph, MA 02368
South Randolph NeighborhoodEstimated Value: $545,855 - $669,000
3
Beds
1
Bath
1,496
Sq Ft
$391/Sq Ft
Est. Value
About This Home
This home is located at 20 Quarry Rd, Randolph, MA 02368 and is currently estimated at $584,714, approximately $390 per square foot. 20 Quarry Rd is a home located in Norfolk County with nearby schools including Randolph High School, Boston Higashi School, and Lighthouse Baptist Christian Academy.
Ownership History
Date
Name
Owned For
Owner Type
Purchase Details
Closed on
Jan 28, 1980
Bought by
Charland Deborah M and Charland Phillip D
Current Estimated Value
Create a Home Valuation Report for This Property
The Home Valuation Report is an in-depth analysis detailing your home's value as well as a comparison with similar homes in the area
Home Values in the Area
Average Home Value in this Area
Purchase History
| Date | Buyer | Sale Price | Title Company |
|---|---|---|---|
| Charland Deborah M | -- | -- |
Source: Public Records
Mortgage History
| Date | Status | Borrower | Loan Amount |
|---|---|---|---|
| Open | Charland Deborah M | $50,000 | |
| Closed | Charland Deborah M | $25,000 | |
| Closed | Charland Deborah M | $112,700 |
Source: Public Records
Tax History Compared to Growth
Tax History
| Year | Tax Paid | Tax Assessment Tax Assessment Total Assessment is a certain percentage of the fair market value that is determined by local assessors to be the total taxable value of land and additions on the property. | Land | Improvement |
|---|---|---|---|---|
| 2025 | $6,279 | $540,800 | $241,900 | $298,900 |
| 2024 | $5,828 | $509,000 | $237,000 | $272,000 |
| 2023 | $5,641 | $467,000 | $215,500 | $251,500 |
| 2022 | $5,515 | $405,500 | $179,600 | $225,900 |
| 2021 | $5,489 | $371,400 | $149,600 | $221,800 |
| 2020 | $5,494 | $368,500 | $149,600 | $218,900 |
| 2019 | $5,271 | $351,900 | $142,500 | $209,400 |
| 2018 | $5,039 | $317,300 | $132,000 | $185,300 |
| 2017 | $4,697 | $290,300 | $125,600 | $164,700 |
| 2016 | $4,706 | $270,600 | $114,300 | $156,300 |
| 2015 | $4,563 | $252,100 | $108,800 | $143,300 |
Source: Public Records
Map
Nearby Homes