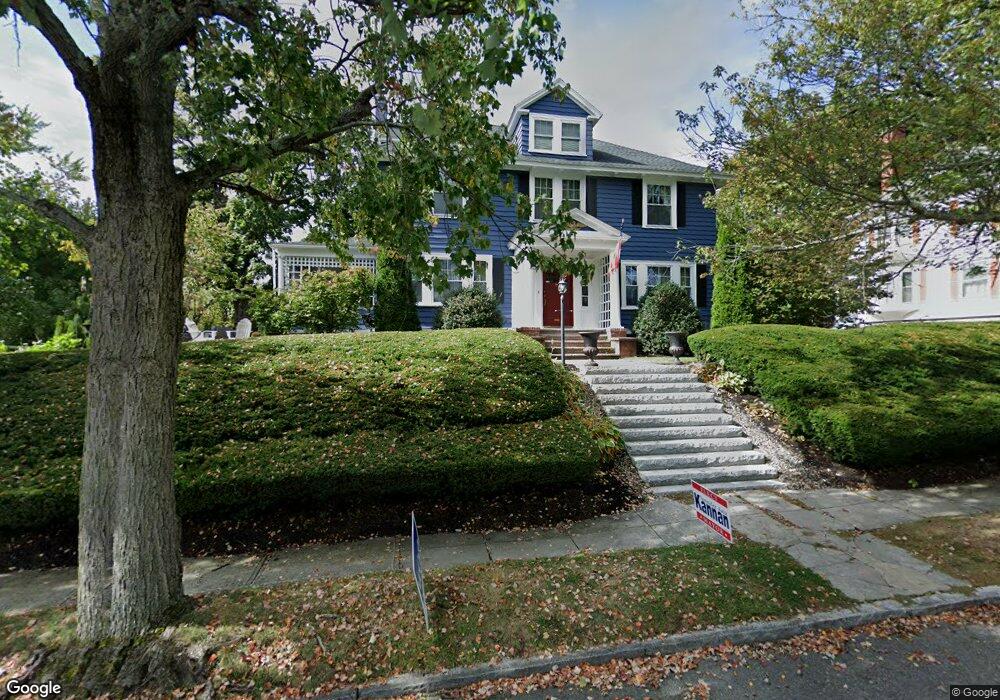
20 Quincy St Methuen, MA 01844
The East End NeighborhoodEstimated Value: $480,000 - $691,000
4
Beds
2
Baths
2,704
Sq Ft
$232/Sq Ft
Est. Value
About This Home
This home is located at 20 Quincy St, Methuen, MA 01844 and is currently estimated at $627,493, approximately $232 per square foot. 20 Quincy St is a home located in Essex County with nearby schools including Timony Grammar School, South Point Elementary School, and Methuen High School.
Ownership History
Date
Name
Owned For
Owner Type
Purchase Details
Closed on
Dec 21, 2020
Sold by
Julmat Ret and Zingales
Bought by
Zingales Joseph and Zingales Teresa
Current Estimated Value
Home Financials for this Owner
Home Financials are based on the most recent Mortgage that was taken out on this home.
Original Mortgage
$386,800
Outstanding Balance
$342,778
Interest Rate
2.7%
Mortgage Type
New Conventional
Estimated Equity
$284,715
Purchase Details
Closed on
Sep 10, 2020
Sold by
Zingales Joseph and Zingales Teresa
Bought by
Julmat Ret and Zingales
Purchase Details
Closed on
Dec 3, 1999
Sold by
Osullivan Gertrude A
Bought by
Zingales Joseph and Zingales Teresa
Create a Home Valuation Report for This Property
The Home Valuation Report is an in-depth analysis detailing your home's value as well as a comparison with similar homes in the area
Home Values in the Area
Average Home Value in this Area
Purchase History
| Date | Buyer | Sale Price | Title Company |
|---|---|---|---|
| Zingales Joseph | -- | None Available | |
| Zingales Joseph | -- | None Available | |
| Zingales Joseph | -- | None Available | |
| Julmat Ret | -- | None Available | |
| Julmat Ret | -- | None Available | |
| Julmat Ret | -- | None Available | |
| Zingales Joseph | $219,900 | -- | |
| Zingales Joseph | $219,900 | -- |
Source: Public Records
Mortgage History
| Date | Status | Borrower | Loan Amount |
|---|---|---|---|
| Open | Zingales Joseph | $386,800 | |
| Closed | Zingales Joseph | $386,800 | |
| Previous Owner | Zingales Joseph | $271,000 | |
| Previous Owner | Zingales Joseph | $60,000 |
Source: Public Records
Tax History Compared to Growth
Tax History
| Year | Tax Paid | Tax Assessment Tax Assessment Total Assessment is a certain percentage of the fair market value that is determined by local assessors to be the total taxable value of land and additions on the property. | Land | Improvement |
|---|---|---|---|---|
| 2025 | $6,712 | $634,400 | $215,600 | $418,800 |
| 2024 | $6,561 | $604,100 | $196,000 | $408,100 |
| 2023 | $6,339 | $541,800 | $175,000 | $366,800 |
| 2022 | $6,165 | $472,400 | $140,000 | $332,400 |
| 2021 | $5,779 | $438,100 | $133,000 | $305,100 |
| 2020 | $5,704 | $424,400 | $133,000 | $291,400 |
| 2019 | $5,526 | $389,400 | $126,000 | $263,400 |
| 2018 | $5,263 | $368,800 | $119,000 | $249,800 |
| 2017 | $4,966 | $339,000 | $112,000 | $227,000 |
| 2016 | $4,849 | $327,400 | $105,000 | $222,400 |
| 2015 | $4,647 | $318,300 | $105,000 | $213,300 |
Source: Public Records
Map
Nearby Homes
- 24 Court St
- 15 Swan Ave
- 24 Boylston St
- 6 Longwood Dr
- 20 Knox St Unit 43
- 20 Knox St Unit 23
- 63 Lippold St
- 35 Swan Ave
- 9 Boylston St
- 7 Magnolia Rd
- 35 Kendall St
- 4 Alderbrook Ln
- 5 Harmony Ln
- 169 Berkeley St
- 167 Ferry 53 Mann St Unit 2,5,6
- 183 Berkeley St
- 37 Albion St
- 3 Woekel Terrace
- 68 Wesley St
- 43 Duston Dr
- 22 Quincy St
- 16 Quincy St
- 16 Quincy St Unit 1
- 477 Prospect St
- 477 Prospect St Unit 477
- 17 Quincy St Unit 19
- 17-19 Quincy St
- 19 Quincy St Unit 1
- 24 Quincy St
- 21 Quincy St
- 479 Prospect St
- 473 Prospect St
- 15 Quincy St
- 12 Quincy St
- 481 Prospect St
- 23 Quincy St
- 48 Olive St
- 26 Quincy St
- 52 Olive St Unit 54
- 471 Prospect St