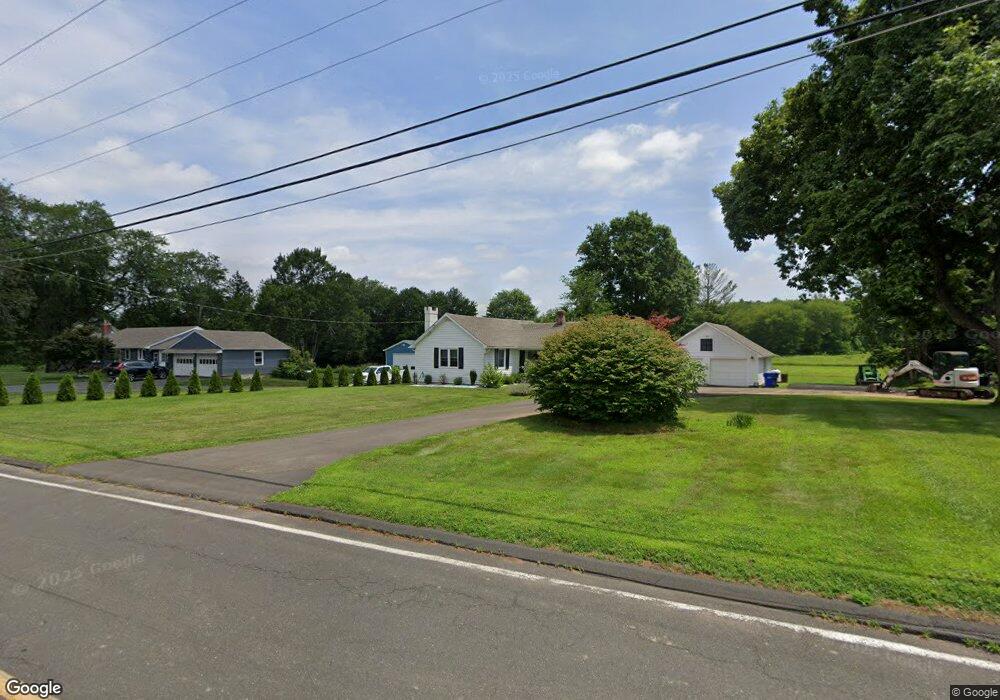
20 Ratley Rd West Suffield, CT 06093
Estimated Value: $352,000 - $382,000
2
Beds
1
Bath
1,072
Sq Ft
$341/Sq Ft
Est. Value
About This Home
This home is located at 20 Ratley Rd, West Suffield, CT 06093 and is currently estimated at $365,710, approximately $341 per square foot. 20 Ratley Rd is a home located in Hartford County with nearby schools including A. Ward Spaulding School, Mcalister Intermediate School, and Suffield Middle School.
Ownership History
Date
Name
Owned For
Owner Type
Purchase Details
Closed on
Aug 10, 2022
Sold by
Classic Bldg & Remodeling
Bought by
Phelps Elliot
Current Estimated Value
Home Financials for this Owner
Home Financials are based on the most recent Mortgage that was taken out on this home.
Original Mortgage
$280,000
Outstanding Balance
$266,505
Interest Rate
5.78%
Mortgage Type
Purchase Money Mortgage
Estimated Equity
$99,205
Purchase Details
Closed on
Aug 1, 2022
Sold by
Classic Bldg & Remodeling and Bourbeau
Bought by
Phelps Elliot
Home Financials for this Owner
Home Financials are based on the most recent Mortgage that was taken out on this home.
Original Mortgage
$280,000
Outstanding Balance
$266,505
Interest Rate
5.78%
Mortgage Type
Purchase Money Mortgage
Estimated Equity
$99,205
Purchase Details
Closed on
Sep 8, 2021
Sold by
Bourbeau Leonard
Bought by
Classic Bldg & Remodeling
Home Financials for this Owner
Home Financials are based on the most recent Mortgage that was taken out on this home.
Original Mortgage
$250,000
Interest Rate
2.9%
Mortgage Type
New Conventional
Purchase Details
Closed on
Mar 12, 2020
Sold by
Holcomb Shirley M Est
Bought by
Holcomb Burton
Create a Home Valuation Report for This Property
The Home Valuation Report is an in-depth analysis detailing your home's value as well as a comparison with similar homes in the area
Home Values in the Area
Average Home Value in this Area
Purchase History
| Date | Buyer | Sale Price | Title Company |
|---|---|---|---|
| Phelps Elliot | -- | None Available | |
| Phelps Elliot | $300,000 | None Available | |
| Classic Bldg & Remodeling | -- | None Available | |
| Holcomb Burton | -- | None Available |
Source: Public Records
Mortgage History
| Date | Status | Borrower | Loan Amount |
|---|---|---|---|
| Open | Phelps Elliot | $280,000 | |
| Previous Owner | Classic Bldg & Remodeling | $250,000 |
Source: Public Records
Tax History
| Year | Tax Paid | Tax Assessment Tax Assessment Total Assessment is a certain percentage of the fair market value that is determined by local assessors to be the total taxable value of land and additions on the property. | Land | Improvement |
|---|---|---|---|---|
| 2025 | $4,500 | $192,220 | $63,210 | $129,010 |
| 2024 | $4,350 | $192,220 | $63,210 | $129,010 |
| 2023 | $3,883 | $135,730 | $63,210 | $72,520 |
| 2022 | $3,883 | $135,730 | $63,210 | $72,520 |
| 2021 | $3,887 | $135,730 | $63,210 | $72,520 |
| 2020 | $3,887 | $135,730 | $63,210 | $72,520 |
| 2019 | $3,898 | $135,730 | $63,210 | $72,520 |
| 2018 | $3,875 | $132,160 | $60,410 | $71,750 |
| 2017 | $3,818 | $132,160 | $60,410 | $71,750 |
| 2016 | $3,727 | $132,160 | $60,410 | $71,750 |
| 2015 | $3,671 | $132,160 | $60,410 | $71,750 |
| 2014 | $3,584 | $132,160 | $60,410 | $71,750 |
Source: Public Records
Map
Nearby Homes
- 1054 Mountain Rd
- 15 Austin Brook Dr
- 200 N Main St
- 02 S Grand St
- 01 S Grand St
- 191 N Main St
- 485 Mountain Rd
- 15 Downing Way
- 1095 S Grand St
- 18 Daniel Cir Unit 18
- 1 E Elaine Dr
- 0 Suffield St Unit 24093452
- 0 Suffield St Unit 24057050
- 2 Stratton Farms Rd
- 24 Coppergate Rd
- 72 Spencer St
- 187 Griffin Rd
- 0 Stone St S Unit 24039713
- 420 Halladay Ave W
- 85 East St
Your Personal Tour Guide
Ask me questions while you tour the home.