20 Raymond Ct Logan, UT 84321
Adams NeighborhoodEstimated Value: $374,000 - $419,499
5
Beds
2
Baths
2,770
Sq Ft
$146/Sq Ft
Est. Value
About This Home
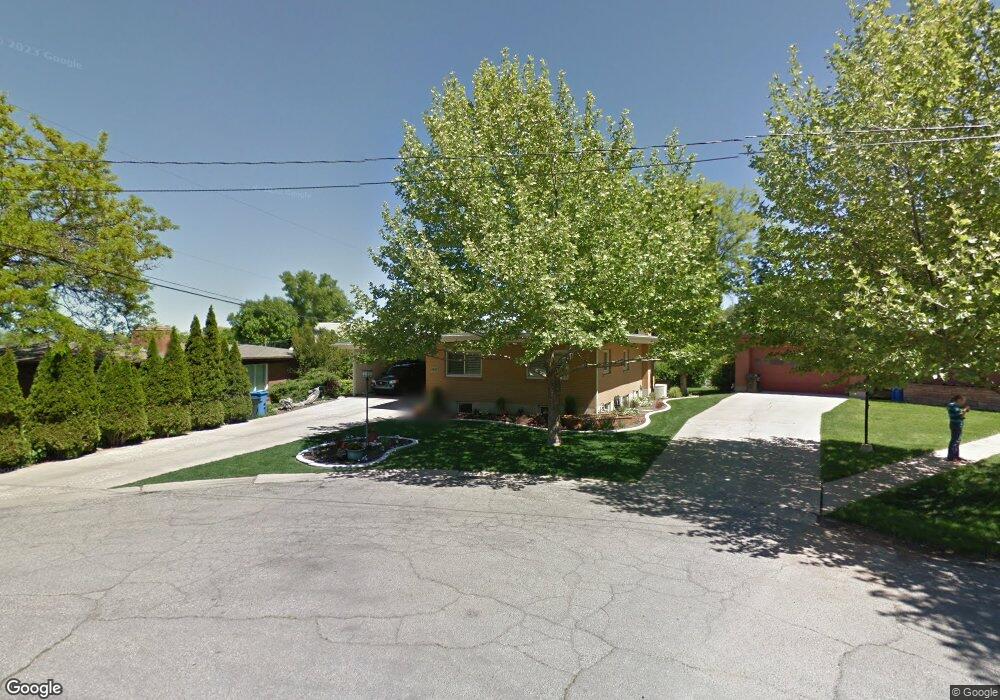
This home is located at 20 Raymond Ct, Logan, UT 84321 and is currently estimated at $404,125, approximately $145 per square foot. 20 Raymond Ct is a home located in Cache County with nearby schools including Adams Elementary School, Mount Logan Middle School, and Logan High School.
Ownership History
Date
Name
Owned For
Owner Type
Purchase Details
Closed on
Dec 30, 2009
Sold by
Gerber Rentals North Llc
Bought by
Gibson James
Current Estimated Value
Home Financials for this Owner
Home Financials are based on the most recent Mortgage that was taken out on this home.
Original Mortgage
$95,000
Outstanding Balance
$61,330
Interest Rate
4.78%
Mortgage Type
Seller Take Back
Estimated Equity
$342,795
Create a Home Valuation Report for This Property
The Home Valuation Report is an in-depth analysis detailing your home's value as well as a comparison with similar homes in the area
Home Values in the Area
Average Home Value in this Area
Purchase History
| Date | Buyer | Sale Price | Title Company |
|---|---|---|---|
| Gibson James | -- | Hickman Land Title Company |
Source: Public Records
Mortgage History
| Date | Status | Borrower | Loan Amount |
|---|---|---|---|
| Open | Gibson James | $95,000 |
Source: Public Records
Tax History Compared to Growth
Tax History
| Year | Tax Paid | Tax Assessment Tax Assessment Total Assessment is a certain percentage of the fair market value that is determined by local assessors to be the total taxable value of land and additions on the property. | Land | Improvement |
|---|---|---|---|---|
| 2025 | $182 | $234,985 | $0 | $0 |
| 2024 | $1,876 | $234,985 | $0 | $0 |
| 2023 | $1,957 | $233,665 | $0 | $0 |
| 2022 | $1,750 | $195,165 | $0 | $0 |
| 2021 | $1,601 | $275,810 | $50,000 | $225,810 |
| 2020 | $1,443 | $223,700 | $50,000 | $173,700 |
| 2019 | $1,508 | $223,700 | $50,000 | $173,700 |
| 2018 | $1,230 | $166,592 | $50,000 | $116,592 |
| 2017 | $1,122 | $80,355 | $0 | $0 |
| 2016 | $1,164 | $80,355 | $0 | $0 |
| 2015 | $1,165 | $80,355 | $0 | $0 |
| 2014 | $1,053 | $80,355 | $0 | $0 |
| 2013 | -- | $80,820 | $0 | $0 |
Source: Public Records
Map
Nearby Homes