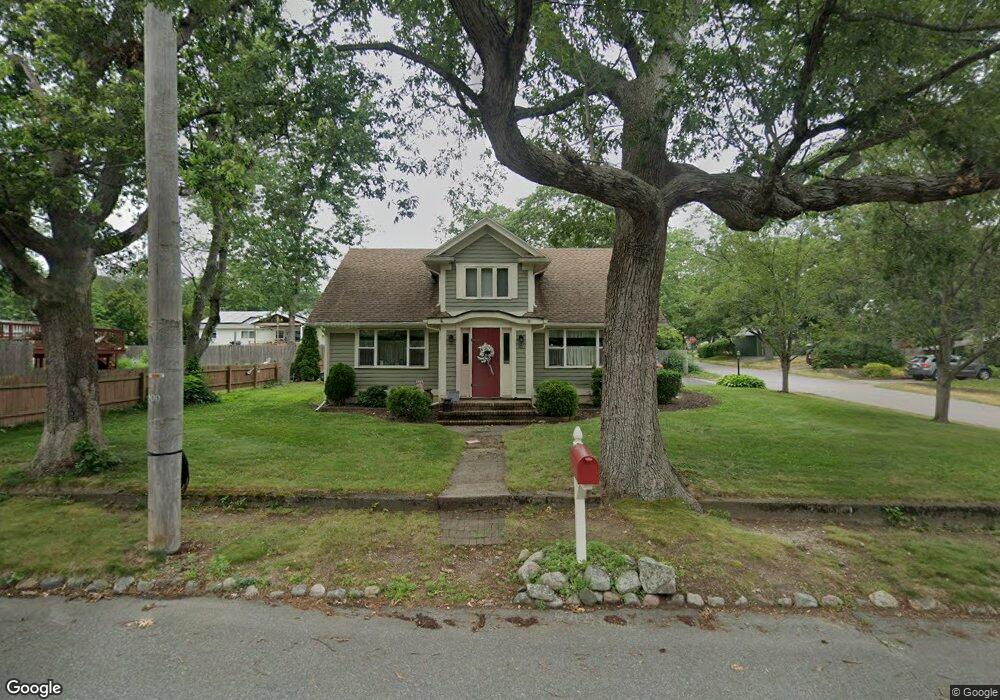
20 Rex Ave Attleboro, MA 02703
Estimated Value: $479,000 - $528,000
3
Beds
2
Baths
1,961
Sq Ft
$256/Sq Ft
Est. Value
About This Home
This home is located at 20 Rex Ave, Attleboro, MA 02703 and is currently estimated at $502,787, approximately $256 per square foot. 20 Rex Ave is a home located in Bristol County with nearby schools including Hill-Roberts Elementary School, Robert J. Coelho Middle School, and Attleboro High School.
Ownership History
Date
Name
Owned For
Owner Type
Purchase Details
Closed on
Feb 15, 2023
Sold by
Gauthier Noramnd T and Gauthier Carol A
Bought by
Gauthier Ft
Current Estimated Value
Purchase Details
Closed on
Nov 25, 1991
Sold by
Gamache Claire L
Bought by
Gauthier Normand and Bradley Carol A
Home Financials for this Owner
Home Financials are based on the most recent Mortgage that was taken out on this home.
Original Mortgage
$99,750
Interest Rate
8.7%
Mortgage Type
Purchase Money Mortgage
Create a Home Valuation Report for This Property
The Home Valuation Report is an in-depth analysis detailing your home's value as well as a comparison with similar homes in the area
Home Values in the Area
Average Home Value in this Area
Purchase History
| Date | Buyer | Sale Price | Title Company |
|---|---|---|---|
| Gauthier Ft | -- | None Available | |
| Gauthier Normand | $105,000 | -- |
Source: Public Records
Mortgage History
| Date | Status | Borrower | Loan Amount |
|---|---|---|---|
| Previous Owner | Gauthier Normand | $104,000 | |
| Previous Owner | Gauthier Normand | $102,000 | |
| Previous Owner | Gauthier Normand | $99,750 |
Source: Public Records
Tax History
| Year | Tax Paid | Tax Assessment Tax Assessment Total Assessment is a certain percentage of the fair market value that is determined by local assessors to be the total taxable value of land and additions on the property. | Land | Improvement |
|---|---|---|---|---|
| 2025 | $4,856 | $386,900 | $124,800 | $262,100 |
| 2024 | $4,701 | $369,300 | $124,800 | $244,500 |
| 2023 | $4,404 | $321,700 | $113,400 | $208,300 |
| 2022 | $4,167 | $288,400 | $108,100 | $180,300 |
| 2021 | $0 | $275,200 | $103,900 | $171,300 |
| 2020 | $3,893 | $267,400 | $100,900 | $166,500 |
| 2019 | $3,670 | $259,200 | $98,900 | $160,300 |
| 2018 | $3,873 | $235,400 | $96,000 | $139,400 |
| 2017 | $3,380 | $232,300 | $96,000 | $136,300 |
| 2016 | $3,287 | $221,800 | $94,200 | $127,600 |
| 2015 | $3,111 | $211,500 | $94,200 | $117,300 |
| 2014 | $3,038 | $204,600 | $89,800 | $114,800 |
Source: Public Records
Map
Nearby Homes
- 18 Newton St
- 54 Baltic St Unit 54
- 52 Baltic St Unit 52
- 58 Baltic St Unit 58
- 56 Baltic St Unit 56
- 50 Pullman Ave Unit A
- 50 Pullman Ave Unit B
- 61 Mendon Rd
- 67 Norton St
- 91 Greenwich St
- 338 Mendon Rd
- 195 Brown St
- 37 Turner St
- 79 Turner St
- 82 Belair Ave
- 386 Mendon Ave
- 460 Collins St Unit 6
- 460 Collins St Unit 9
- 416 Brown St
- 23 Magnolia St Unit 2
- 30 Rex Ave
- 14 Rex Ave
- 13 Guild Ave
- 13 Rex Ave
- 440 Robinson Ave
- 444 Robinson Ave
- 35 Guild Ave
- 20 Guild Ave
- 12 Guild Ave
- 12 Guild Ave
- 883 Washington St
- 452 Robinson Ave
- 445 Robinson Ave
- 0 Guild Ave Lot 6
- 431 Robinson Ave
- 426 Robinson Ave
- 27 Curtis Ave
- 923 Washington St
- 923 Washington St
- 456 Robinson Ave
Your Personal Tour Guide
Ask me questions while you tour the home.