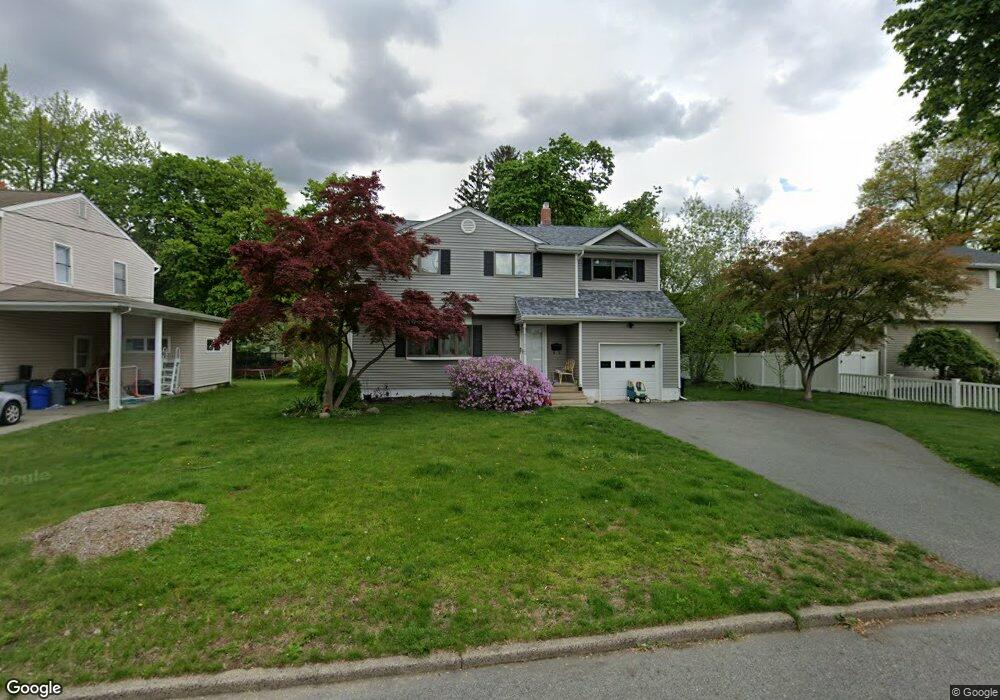
20 Richards St Pequannock, NJ 07440
Estimated Value: $593,128 - $686,000
Studio
--
Bath
1,922
Sq Ft
$338/Sq Ft
Est. Value
About This Home
This home is located at 20 Richards St, Pequannock, NJ 07440 and is currently estimated at $649,782, approximately $338 per square foot. 20 Richards St is a home located in Morris County with nearby schools including Pequannock Twp High School, Holy Spirit School, and Kolbe Immaculata School.
Ownership History
Date
Name
Owned For
Owner Type
Purchase Details
Closed on
Apr 15, 2004
Sold by
Mcgeough Francis
Bought by
Chapman Gary and Chapman Sharon Mcgeough
Current Estimated Value
Home Financials for this Owner
Home Financials are based on the most recent Mortgage that was taken out on this home.
Original Mortgage
$155,000
Outstanding Balance
$71,616
Interest Rate
5.4%
Mortgage Type
VA
Estimated Equity
$578,166
Create a Home Valuation Report for This Property
The Home Valuation Report is an in-depth analysis detailing your home's value as well as a comparison with similar homes in the area
Home Values in the Area
Average Home Value in this Area
Purchase History
| Date | Buyer | Sale Price | Title Company |
|---|---|---|---|
| Chapman Gary | $156,000 | -- |
Source: Public Records
Mortgage History
| Date | Status | Borrower | Loan Amount |
|---|---|---|---|
| Open | Chapman Gary | $155,000 |
Source: Public Records
Tax History
| Year | Tax Paid | Tax Assessment Tax Assessment Total Assessment is a certain percentage of the fair market value that is determined by local assessors to be the total taxable value of land and additions on the property. | Land | Improvement |
|---|---|---|---|---|
| 2025 | $9,510 | $527,900 | $296,100 | $231,800 |
| 2024 | $9,166 | $521,100 | $291,600 | $229,500 |
Source: Public Records
Map
Nearby Homes
- 27 Marlin Ave
- 43 Madison St
- 48 Caroline Ave
- 105 Newark Pompton Turnpike Unit 21
- 2 Michael Ct
- 00 Oakwood Ave
- 12 Oakwood Ave
- 0 Oakwood Ave Unit 3989632
- 26 Pequannock Ave
- 92 Mandeville Ave
- 15 Slingerland Ave
- 2 Marvin Rd
- 45 Kime Ave
- 45 Village Rd
- 5 Ferndale Rd
- 520 Newark Pompton Turnpike Unit C222
- 520 Turnpike C112 Unit C112
- 520 Turnpike C222 Unit 222
- 21 Romondt Rd
- 19 Colfax Dr
Your Personal Tour Guide
Ask me questions while you tour the home.