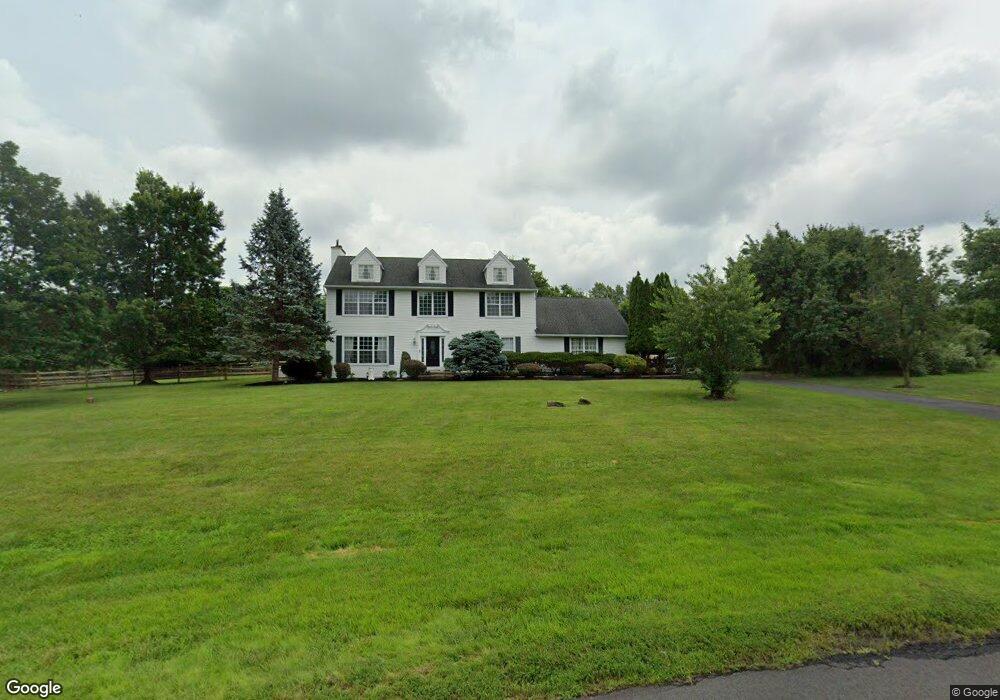
20 Ridings Pkwy Princeton, NJ 08540
Estimated Value: $940,091 - $1,108,000
--
Bed
--
Bath
3,129
Sq Ft
$320/Sq Ft
Est. Value
About This Home
This home is located at 20 Ridings Pkwy, Princeton, NJ 08540 and is currently estimated at $1,001,773, approximately $320 per square foot. 20 Ridings Pkwy is a home located in Somerset County with nearby schools including Franklin High School, Guidepost Montessori at Kendall Park, and St. Augustine of Canterbury School.
Ownership History
Date
Name
Owned For
Owner Type
Purchase Details
Closed on
Jun 28, 2004
Sold by
Pettiford Mark A
Bought by
Cable Gregory and Cable Mary Kelly
Current Estimated Value
Home Financials for this Owner
Home Financials are based on the most recent Mortgage that was taken out on this home.
Original Mortgage
$369,900
Outstanding Balance
$186,004
Interest Rate
6.32%
Estimated Equity
$815,769
Purchase Details
Closed on
Jun 30, 1998
Sold by
Sullivan Michaeal G
Bought by
Pettiford Mark and Pettiford Porsche
Home Financials for this Owner
Home Financials are based on the most recent Mortgage that was taken out on this home.
Original Mortgage
$279,000
Interest Rate
7.04%
Purchase Details
Closed on
Apr 28, 1994
Sold by
The Princeton Riding Grp
Bought by
Sullivan Michael and Sullivan Julie
Home Financials for this Owner
Home Financials are based on the most recent Mortgage that was taken out on this home.
Original Mortgage
$242,000
Interest Rate
7.7%
Create a Home Valuation Report for This Property
The Home Valuation Report is an in-depth analysis detailing your home's value as well as a comparison with similar homes in the area
Home Values in the Area
Average Home Value in this Area
Purchase History
| Date | Buyer | Sale Price | Title Company |
|---|---|---|---|
| Cable Gregory | $599,900 | -- | |
| Pettiford Mark | $310,000 | -- | |
| Sullivan Michael | $263,275 | -- |
Source: Public Records
Mortgage History
| Date | Status | Borrower | Loan Amount |
|---|---|---|---|
| Open | Cable Gregory | $369,900 | |
| Previous Owner | Pettiford Mark | $279,000 | |
| Previous Owner | Sullivan Michael | $242,000 |
Source: Public Records
Tax History Compared to Growth
Tax History
| Year | Tax Paid | Tax Assessment Tax Assessment Total Assessment is a certain percentage of the fair market value that is determined by local assessors to be the total taxable value of land and additions on the property. | Land | Improvement |
|---|---|---|---|---|
| 2025 | $13,083 | $873,600 | $431,700 | $441,900 |
| 2024 | $13,083 | $725,600 | $431,700 | $293,900 |
| 2023 | $12,216 | $635,600 | $341,700 | $293,900 |
| 2022 | $11,673 | $575,600 | $281,700 | $293,900 |
| 2021 | $10,750 | $487,100 | $193,200 | $293,900 |
| 2020 | $10,552 | $467,100 | $173,200 | $293,900 |
| 2019 | $10,454 | $457,100 | $163,200 | $293,900 |
| 2018 | $11,640 | $503,900 | $173,200 | $330,700 |
| 2017 | $11,685 | $503,900 | $173,200 | $330,700 |
| 2016 | $11,786 | $503,900 | $173,200 | $330,700 |
| 2015 | $11,706 | $503,900 | $173,200 | $330,700 |
| 2014 | $11,529 | $503,900 | $173,200 | $330,700 |
Source: Public Records
Map
Nearby Homes
- 18 Ridings Pkwy
- 13 Mansfield Rd
- 23 Ridings Pkwy
- 21 Ridings Pkwy
- 16 Ridings Pkwy
- 9 Mansfield Rd
- 24 Ridings Pkwy
- 14 Mansfield Rd
- 25 Ridings Pkwy
- 5 Mansfield Rd
- 19 Ridings Pkwy
- 14 Ridings Pkwy
- 26 Ridings Pkwy
- 10 Mansfield Rd
- 17 Barbieri Ct
- 6 Mansfield Rd
- 17 Ridings Pkwy
- 1 Mansfield Rd
- 27 Ridings Pkwy
- 15 Barbieri Ct