20 River St Marlborough, MA 01752
Estimated Value: $304,000 - $413,993
2
Beds
1
Bath
936
Sq Ft
$401/Sq Ft
Est. Value
About This Home
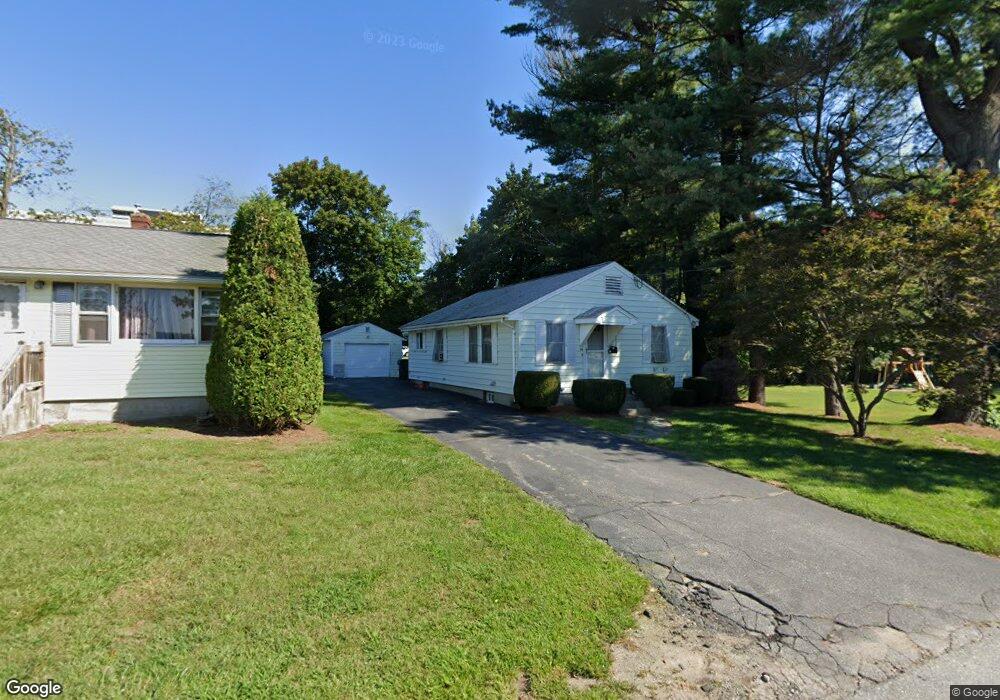
This home is located at 20 River St, Marlborough, MA 01752 and is currently estimated at $375,248, approximately $400 per square foot. 20 River St is a home located in Middlesex County with nearby schools including Marlborough High School, New Covenant Christian School, and Glenhaven Academy - JRI School.
Ownership History
Date
Name
Owned For
Owner Type
Purchase Details
Closed on
Oct 9, 2018
Sold by
Marianne M Foley T
Bought by
Ferreira Julio C
Current Estimated Value
Purchase Details
Closed on
Nov 10, 2017
Sold by
Foley Marianne M
Bought by
Marianne M Foley T
Purchase Details
Closed on
Oct 27, 2014
Sold by
Foley John J and Foley Marianne M
Bought by
Foley Marianne M
Purchase Details
Closed on
Dec 27, 2011
Sold by
Bath Genie Inc
Bought by
Foley John J and Foley Marianne M
Purchase Details
Closed on
Jun 13, 1997
Sold by
Tuzi Raymond
Bought by
Bath Genie Inc
Home Financials for this Owner
Home Financials are based on the most recent Mortgage that was taken out on this home.
Original Mortgage
$90,000
Interest Rate
7.97%
Mortgage Type
Purchase Money Mortgage
Create a Home Valuation Report for This Property
The Home Valuation Report is an in-depth analysis detailing your home's value as well as a comparison with similar homes in the area
Home Values in the Area
Average Home Value in this Area
Purchase History
| Date | Buyer | Sale Price | Title Company |
|---|---|---|---|
| Ferreira Julio C | $180,000 | -- | |
| Marianne M Foley T | -- | -- | |
| Foley Marianne M | -- | -- | |
| Foley John J | -- | -- | |
| Bath Genie Inc | $115,000 | -- |
Source: Public Records
Mortgage History
| Date | Status | Borrower | Loan Amount |
|---|---|---|---|
| Previous Owner | Bath Genie Inc | $90,000 | |
| Previous Owner | Bath Genie Inc | $47,000 | |
| Closed | Bath Genie Inc | $15,000 |
Source: Public Records
Tax History Compared to Growth
Tax History
| Year | Tax Paid | Tax Assessment Tax Assessment Total Assessment is a certain percentage of the fair market value that is determined by local assessors to be the total taxable value of land and additions on the property. | Land | Improvement |
|---|---|---|---|---|
| 2025 | $3,168 | $321,300 | $155,900 | $165,400 |
| 2024 | $3,210 | $313,500 | $141,700 | $171,800 |
| 2023 | $3,491 | $302,500 | $117,300 | $185,200 |
| 2022 | $3,402 | $259,300 | $111,700 | $147,600 |
| 2021 | $3,414 | $247,400 | $93,100 | $154,300 |
| 2020 | $3,413 | $240,700 | $90,700 | $150,000 |
| 2019 | $3,346 | $237,800 | $88,900 | $148,900 |
| 2018 | $3,020 | $206,400 | $68,900 | $137,500 |
| 2017 | $2,753 | $179,700 | $68,800 | $110,900 |
| 2016 | $2,563 | $167,100 | $68,800 | $98,300 |
| 2015 | $2,511 | $159,300 | $72,400 | $86,900 |
Source: Public Records
Map
Nearby Homes