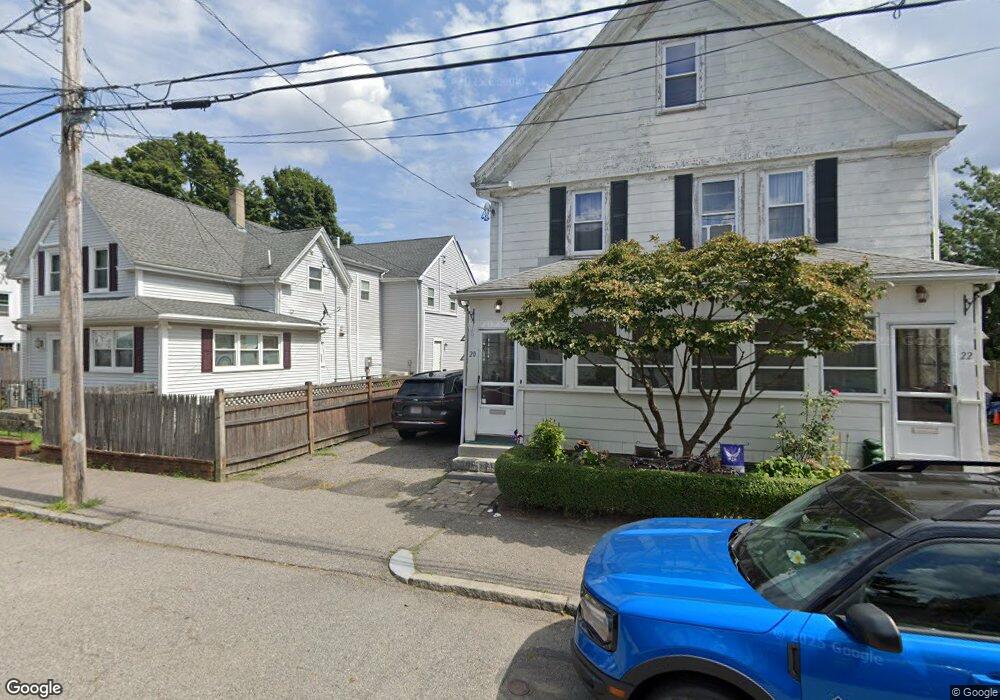
20 Rodman St Quincy, MA 02169
South Quincy NeighborhoodEstimated Value: $786,000 - $1,126,000
6
Beds
2
Baths
2,530
Sq Ft
$371/Sq Ft
Est. Value
About This Home
This home is located at 20 Rodman St, Quincy, MA 02169 and is currently estimated at $938,343, approximately $370 per square foot. 20 Rodman St is a home located in Norfolk County with nearby schools including South West Middle School, Lincoln-Hancock Community School, and Quincy High School.
Ownership History
Date
Name
Owned For
Owner Type
Purchase Details
Closed on
Mar 29, 1999
Sold by
Salvucci Richard L and Salvucci Cornelia F
Bought by
Healy Brian T
Current Estimated Value
Home Financials for this Owner
Home Financials are based on the most recent Mortgage that was taken out on this home.
Original Mortgage
$213,839
Outstanding Balance
$52,978
Interest Rate
6.78%
Mortgage Type
Purchase Money Mortgage
Estimated Equity
$885,365
Create a Home Valuation Report for This Property
The Home Valuation Report is an in-depth analysis detailing your home's value as well as a comparison with similar homes in the area
Home Values in the Area
Average Home Value in this Area
Purchase History
| Date | Buyer | Sale Price | Title Company |
|---|---|---|---|
| Healy Brian T | $215,000 | -- |
Source: Public Records
Mortgage History
| Date | Status | Borrower | Loan Amount |
|---|---|---|---|
| Open | Healy Brian T | $213,839 |
Source: Public Records
Tax History Compared to Growth
Tax History
| Year | Tax Paid | Tax Assessment Tax Assessment Total Assessment is a certain percentage of the fair market value that is determined by local assessors to be the total taxable value of land and additions on the property. | Land | Improvement |
|---|---|---|---|---|
| 2025 | $9,960 | $863,800 | $282,100 | $581,700 |
| 2024 | $9,386 | $832,800 | $268,700 | $564,100 |
| 2023 | $8,800 | $790,700 | $244,300 | $546,400 |
| 2022 | $8,761 | $731,300 | $203,500 | $527,800 |
| 2021 | $8,920 | $734,800 | $203,500 | $531,300 |
| 2020 | $8,814 | $709,100 | $203,500 | $505,600 |
| 2019 | $8,395 | $668,900 | $192,000 | $476,900 |
| 2018 | $7,757 | $581,500 | $177,800 | $403,700 |
| 2017 | $7,808 | $551,000 | $169,400 | $381,600 |
| 2016 | $6,725 | $468,300 | $147,200 | $321,100 |
| 2015 | $6,589 | $451,300 | $147,200 | $304,100 |
| 2014 | $5,758 | $387,500 | $147,200 | $240,300 |
Source: Public Records
Map
Nearby Homes
- 56 Penn St Unit 4
- 347 Centre St
- 21 Totman St Unit 204
- 21 Totman St Unit 306
- 21 Totman St Unit 410
- 21 Totman St Unit 309
- 21 Totman St Unit Model-1
- 21 Totman St Unit 202
- 21 Totman St Unit 2
- 203 Centre St
- 72 Federal Ave
- 8 Jackson St Unit B2
- 192 Federal Ave Unit B
- 33 Brook Rd
- 64 Garfield St Unit B
- 195 Independence Ave Unit 137
- 218 Independence Ave Unit B
- 21 Arthur St
- 12 Arthur Ave
- 36 Greystone St Unit 36
- 16 Rodman St
- 34 Taber St
- 36 Taber St Unit 36
- 36 Taber St
- 36 Taber St Unit 1
- 27 Trafford St Unit 29
- 44 Taber St Unit 2
- 44 Taber St
- 23 Trafford St
- 10 Rodman St
- 26 Taber St
- 26 Taber St Unit 1
- 26 Taber St Unit 26
- 17 Rodman St
- 28 Taber St Unit 1
- 17 Trafford St
- 13 Rodman St
- 8 Rodman St
- 41 Trafford St
- 39 Taber St