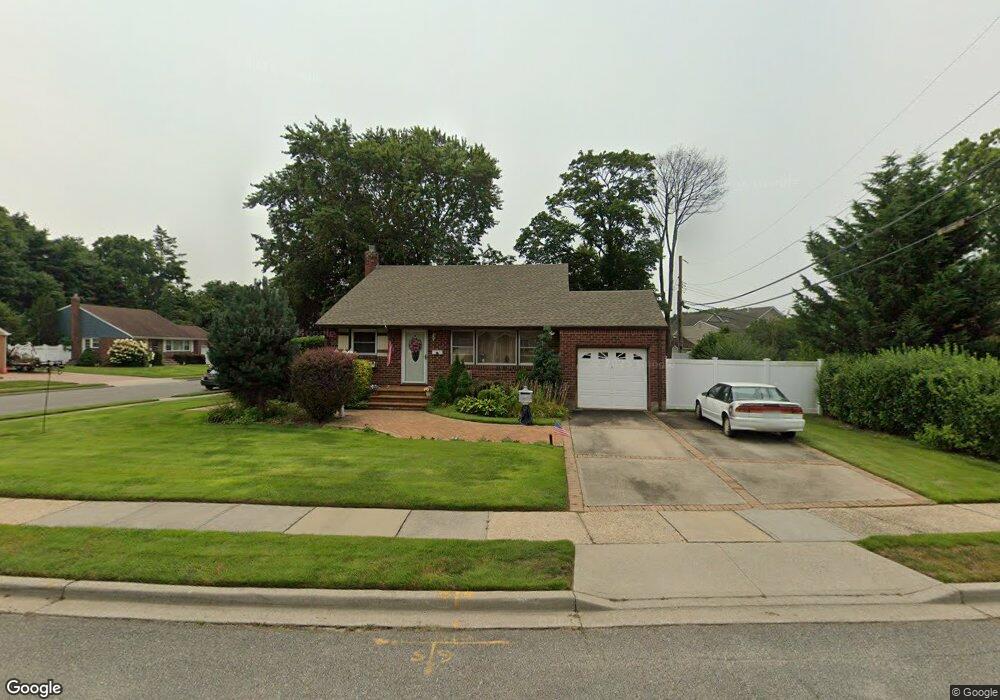
20 Ronnie Ln Bethpage, NY 11714
Estimated Value: $688,289 - $842,000
Studio
2
Baths
1,080
Sq Ft
$708/Sq Ft
Est. Value
About This Home
This home is located at 20 Ronnie Ln, Bethpage, NY 11714 and is currently estimated at $765,145, approximately $708 per square foot. 20 Ronnie Ln is a home located in Nassau County with nearby schools including Charles Campagne Elementary School, John F Kennedy Middle School, and Bethpage Senior High School.
Ownership History
Date
Name
Owned For
Owner Type
Purchase Details
Closed on
Nov 8, 2019
Sold by
Catrone Frank J and Catrone Marie J
Bought by
Catrone Family 2019 Trust
Current Estimated Value
Purchase Details
Closed on
Jul 16, 2007
Sold by
Catrone Frank
Create a Home Valuation Report for This Property
The Home Valuation Report is an in-depth analysis detailing your home's value as well as a comparison with similar homes in the area
Home Values in the Area
Average Home Value in this Area
Purchase History
| Date | Buyer | Sale Price | Title Company |
|---|---|---|---|
| Catrone Family 2019 Trust | -- | None Available | |
| -- | -- | -- |
Source: Public Records
Tax History
| Year | Tax Paid | Tax Assessment Tax Assessment Total Assessment is a certain percentage of the fair market value that is determined by local assessors to be the total taxable value of land and additions on the property. | Land | Improvement |
|---|---|---|---|---|
| 2025 | $11,981 | $489 | $264 | $225 |
| 2024 | $4,199 | $495 | $268 | $227 |
Source: Public Records
Map
Nearby Homes
Your Personal Tour Guide
Ask me questions while you tour the home.