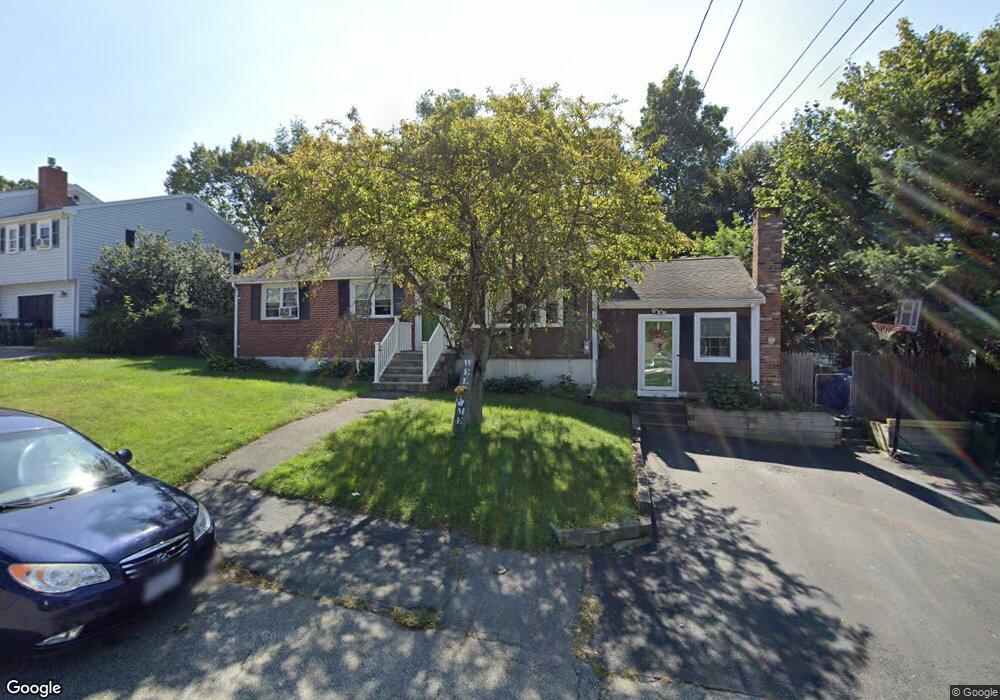
20 Rose Way Holbrook, MA 02343
Estimated Value: $545,000 - $619,561
4
Beds
2
Baths
1,268
Sq Ft
$464/Sq Ft
Est. Value
About This Home
This home is located at 20 Rose Way, Holbrook, MA 02343 and is currently estimated at $588,640, approximately $464 per square foot. 20 Rose Way is a home located in Norfolk County with nearby schools including John F. Kennedy Elementary School, Holbrook Middle High School, and Boston Higashi School.
Ownership History
Date
Name
Owned For
Owner Type
Purchase Details
Closed on
Jul 9, 2004
Sold by
Pietrantonio Lorraine
Bought by
Duffy Kara M and Duffy Patrick J
Current Estimated Value
Home Financials for this Owner
Home Financials are based on the most recent Mortgage that was taken out on this home.
Original Mortgage
$291,650
Outstanding Balance
$146,656
Interest Rate
6.32%
Mortgage Type
Purchase Money Mortgage
Estimated Equity
$441,984
Create a Home Valuation Report for This Property
The Home Valuation Report is an in-depth analysis detailing your home's value as well as a comparison with similar homes in the area
Home Values in the Area
Average Home Value in this Area
Purchase History
| Date | Buyer | Sale Price | Title Company |
|---|---|---|---|
| Duffy Kara M | $307,000 | -- | |
| Duffy Kara M | $307,000 | -- |
Source: Public Records
Mortgage History
| Date | Status | Borrower | Loan Amount |
|---|---|---|---|
| Open | Duffy Kara M | $291,650 | |
| Closed | Duffy Kara M | $291,650 |
Source: Public Records
Tax History
| Year | Tax Paid | Tax Assessment Tax Assessment Total Assessment is a certain percentage of the fair market value that is determined by local assessors to be the total taxable value of land and additions on the property. | Land | Improvement |
|---|---|---|---|---|
| 2025 | $5,782 | $438,700 | $221,800 | $216,900 |
| 2024 | $5,606 | $417,100 | $210,400 | $206,700 |
| 2023 | $5,941 | $386,300 | $191,300 | $195,000 |
| 2022 | $5,605 | $339,900 | $173,900 | $166,000 |
| 2021 | $5,500 | $319,400 | $162,500 | $156,900 |
| 2020 | $5,575 | $303,500 | $154,300 | $149,200 |
| 2019 | $5,447 | $279,900 | $137,900 | $142,000 |
| 2018 | $5,678 | $274,700 | $137,900 | $136,800 |
| 2017 | $5,290 | $253,100 | $121,500 | $131,600 |
| 2016 | $4,922 | $250,600 | $121,500 | $129,100 |
| 2015 | $4,640 | $243,200 | $120,600 | $122,600 |
| 2014 | $4,445 | $236,800 | $120,600 | $116,200 |
Source: Public Records
Map
Nearby Homes
- 8 Dianthus Rd
- 38 Roosevelt St
- 278 N Franklin St
- 1696 Liberty St
- 123-125 N Franklin St
- 5 Clarendon Cir Unit Lot 4
- 129 Albee Dr
- 27 Winter St
- 120 Roberts Ave
- 20 Isabelle Ave
- 24 Evelyn Ln
- 155 Union St
- 220 Weymouth St
- 152 S Franklin St
- 1 Young Terrace
- 249 Mill St
- 181 S Franklin St Unit 102
- 181 S Franklin St Unit 206
- 229 Mill St
- 217 Mill St
Your Personal Tour Guide
Ask me questions while you tour the home.