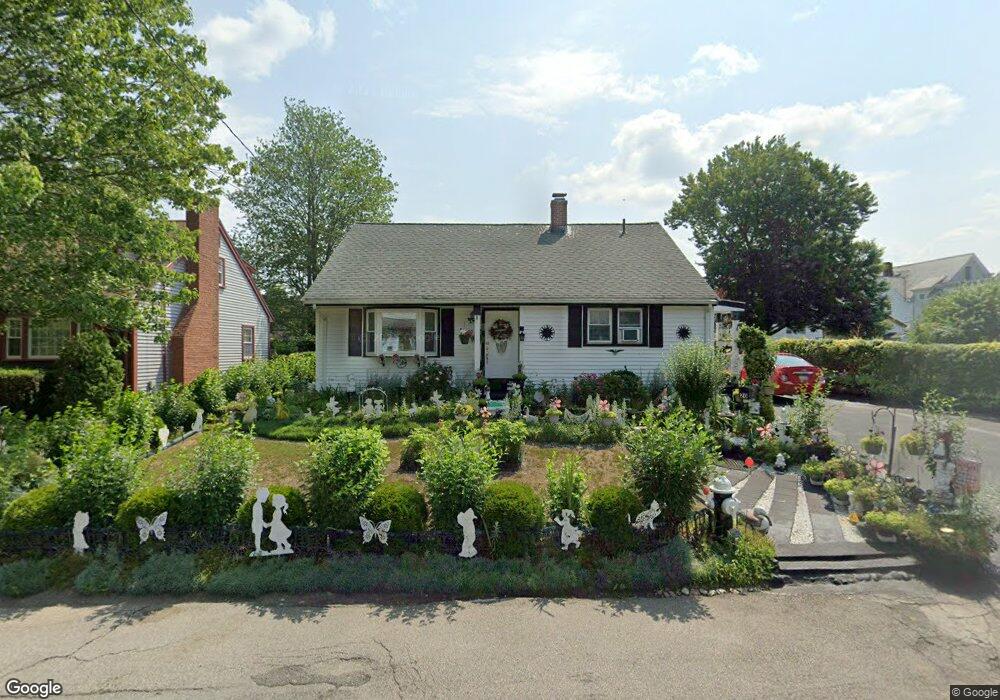
20 Rufus St Brockton, MA 02302
Estimated Value: $454,000 - $490,000
3
Beds
1
Bath
1,376
Sq Ft
$345/Sq Ft
Est. Value
About This Home
This home is located at 20 Rufus St, Brockton, MA 02302 and is currently estimated at $474,570, approximately $344 per square foot. 20 Rufus St is a home located in Plymouth County with nearby schools including Arnone Elementary School, Joseph F. Plouffe Middle School, and Brockton Area Seventh-Day Adventist Academy.
Ownership History
Date
Name
Owned For
Owner Type
Purchase Details
Closed on
Apr 21, 2005
Sold by
Mccleskey Ira
Bought by
Bettencourt Jorge and Bettencourt Emily
Current Estimated Value
Home Financials for this Owner
Home Financials are based on the most recent Mortgage that was taken out on this home.
Original Mortgage
$187,920
Interest Rate
5.87%
Mortgage Type
Purchase Money Mortgage
Purchase Details
Closed on
Nov 7, 1997
Sold by
Usa Va
Bought by
Mccleskey Ira
Purchase Details
Closed on
Sep 16, 1997
Sold by
Mccleskey Ira
Bought by
Usa Va
Purchase Details
Closed on
Aug 2, 1991
Sold by
Sadagursky Paul and Sadagursky Mary Ernest
Bought by
Mccleskey Ira
Create a Home Valuation Report for This Property
The Home Valuation Report is an in-depth analysis detailing your home's value as well as a comparison with similar homes in the area
Home Values in the Area
Average Home Value in this Area
Purchase History
| Date | Buyer | Sale Price | Title Company |
|---|---|---|---|
| Bettencourt Jorge | $234,900 | -- | |
| Mccleskey Ira | $104,500 | -- | |
| Usa Va | $71,762 | -- | |
| Mccleskey Ira | $95,000 | -- |
Source: Public Records
Mortgage History
| Date | Status | Borrower | Loan Amount |
|---|---|---|---|
| Open | Mccleskey Ira | $194,800 | |
| Closed | Mccleskey Ira | $48,700 | |
| Closed | Mccleskey Ira | $187,920 |
Source: Public Records
Tax History Compared to Growth
Tax History
| Year | Tax Paid | Tax Assessment Tax Assessment Total Assessment is a certain percentage of the fair market value that is determined by local assessors to be the total taxable value of land and additions on the property. | Land | Improvement |
|---|---|---|---|---|
| 2025 | $4,854 | $400,800 | $137,500 | $263,300 |
| 2024 | $4,807 | $399,900 | $137,500 | $262,400 |
| 2023 | $4,806 | $370,300 | $102,600 | $267,700 |
| 2022 | $4,447 | $318,300 | $93,100 | $225,200 |
| 2021 | $4,166 | $287,300 | $77,100 | $210,200 |
| 2020 | $3,804 | $251,100 | $72,600 | $178,500 |
| 2019 | $3,812 | $245,300 | $70,400 | $174,900 |
| 2018 | $3,591 | $223,600 | $70,400 | $153,200 |
| 2017 | $3,075 | $191,000 | $70,400 | $120,600 |
| 2016 | $3,180 | $183,200 | $68,200 | $115,000 |
| 2015 | $2,819 | $155,300 | $68,200 | $87,100 |
| 2014 | $2,972 | $163,900 | $68,200 | $95,700 |
Source: Public Records
Map
Nearby Homes