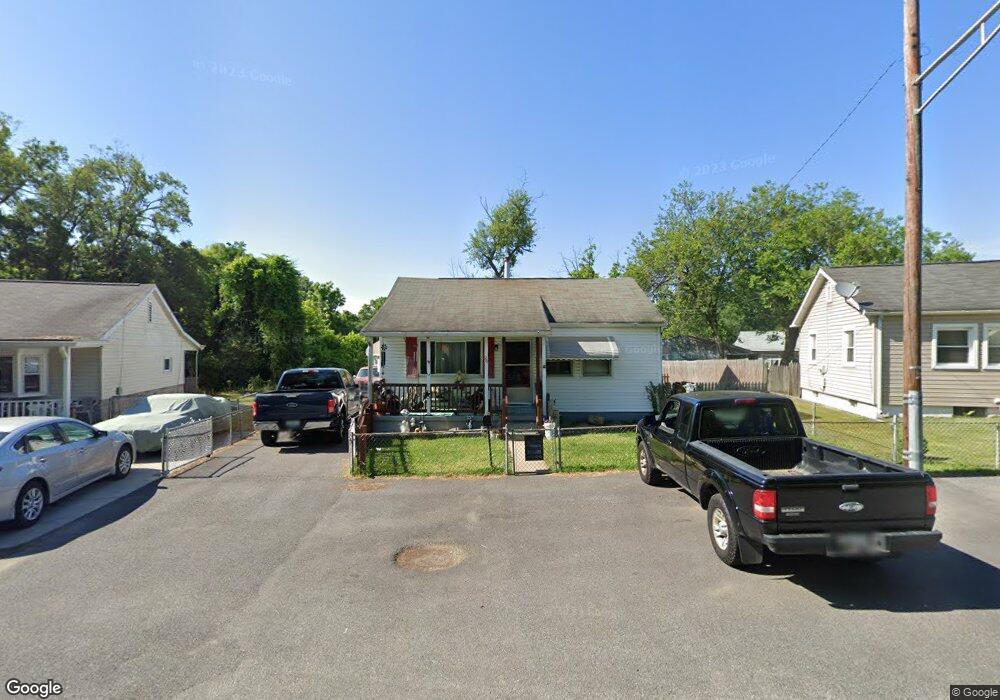
20 Runway Ct Middle River, MD 21220
Estimated Value: $255,000 - $310,000
Studio
1
Bath
1,044
Sq Ft
$261/Sq Ft
Est. Value
About This Home
This home is located at 20 Runway Ct, Middle River, MD 21220 and is currently estimated at $272,143, approximately $260 per square foot. 20 Runway Ct is a home located in Baltimore County with nearby schools including Victory Villa Elementary School, Middle River Middle School, and Kenwood High.
Ownership History
Date
Name
Owned For
Owner Type
Purchase Details
Closed on
Sep 20, 2005
Sold by
Rode William C
Bought by
Rode William C and Rode Karen
Current Estimated Value
Home Financials for this Owner
Home Financials are based on the most recent Mortgage that was taken out on this home.
Original Mortgage
$120,000
Outstanding Balance
$63,958
Interest Rate
5.79%
Mortgage Type
New Conventional
Estimated Equity
$208,185
Purchase Details
Closed on
Apr 3, 2000
Sold by
Dymond Dean Barry
Bought by
Dymond Dean Barry
Purchase Details
Closed on
Sep 28, 1990
Sold by
Secretary Of The Department Of
Bought by
Dymond Dean Barry
Create a Home Valuation Report for This Property
The Home Valuation Report is an in-depth analysis detailing your home's value as well as a comparison with similar homes in the area
Home Values in the Area
Average Home Value in this Area
Purchase History
| Date | Buyer | Sale Price | Title Company |
|---|---|---|---|
| Rode William C | -- | -- | |
| Dymond Dean Barry | $94,000 | -- | |
| Dymond Dean Barry | $57,000 | -- |
Source: Public Records
Mortgage History
| Date | Status | Borrower | Loan Amount |
|---|---|---|---|
| Open | Rode William C | $120,000 |
Source: Public Records
Tax History
| Year | Tax Paid | Tax Assessment Tax Assessment Total Assessment is a certain percentage of the fair market value that is determined by local assessors to be the total taxable value of land and additions on the property. | Land | Improvement |
|---|---|---|---|---|
| 2025 | $3,118 | $176,133 | -- | -- |
| 2024 | $3,118 | $166,867 | $0 | $0 |
| 2023 | $1,588 | $157,600 | $53,900 | $103,700 |
| 2022 | $2,994 | $151,367 | $0 | $0 |
| 2021 | $2,782 | $145,133 | $0 | $0 |
| 2020 | $2,782 | $138,900 | $53,900 | $85,000 |
| 2019 | $2,706 | $138,333 | $0 | $0 |
| 2018 | $2,559 | $137,767 | $0 | $0 |
| 2017 | $2,622 | $137,200 | $0 | $0 |
| 2016 | $2,177 | $136,600 | $0 | $0 |
| 2015 | $2,177 | $136,000 | $0 | $0 |
| 2014 | $2,177 | $135,400 | $0 | $0 |
Source: Public Records
Map
Nearby Homes
- 8 Control Ct
- 18 Armor Ct
- 57 Transverse Ave
- 1008 Fuselage Ave
- 66 Transverse Ave
- 2 Strut Ct
- 17 Propeller Dr
- 902 Cord St
- 1800 Watermark Way
- 1201 Fuselage Ave
- 1018 Cord St
- 33 Left Wing Dr
- 35 Rockywood Ln
- 815 Lowe Rd
- 74 Yew Rd
- 109 Judywood Ln
- 18 Blister St
- 8908 Golden Tree Ln
- 49 Rockywood Ln
- 116 Old Maple Ct
Your Personal Tour Guide
Ask me questions while you tour the home.