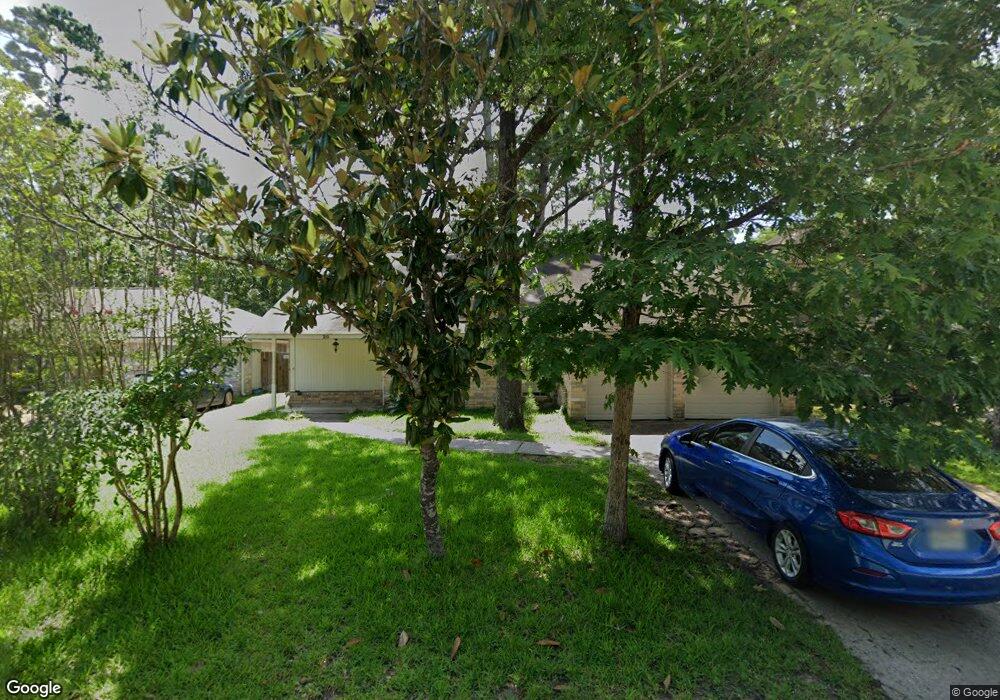
20 S Drifting Leaf Ct Spring, TX 77380
Grogan's Mill NeighborhoodEstimated Value: $311,027 - $370,000
3
Beds
3
Baths
1,846
Sq Ft
$185/Sq Ft
Est. Value
About This Home
This home is located at 20 S Drifting Leaf Ct, Spring, TX 77380 and is currently estimated at $341,007, approximately $184 per square foot. 20 S Drifting Leaf Ct is a home located in Montgomery County with nearby schools including Hailey Elementary School, W.D Wilkerson Intermediate School, and Knox J High School.
Ownership History
Date
Name
Owned For
Owner Type
Purchase Details
Closed on
Jul 8, 2022
Sold by
Lau Rodriguez Ma Leonor
Bought by
Ezco Investments Llc
Current Estimated Value
Purchase Details
Closed on
May 18, 2016
Sold by
Ostinelli Stephen and Ostinelli Linda
Bought by
Rodriguez Ma Leonor Lau
Purchase Details
Closed on
Sep 8, 1998
Sold by
Thoms Steven Lester and Thoms Lisa M
Bought by
Ostinelli Stephen and Ostinelli Linda
Home Financials for this Owner
Home Financials are based on the most recent Mortgage that was taken out on this home.
Original Mortgage
$89,900
Interest Rate
6.95%
Purchase Details
Closed on
Apr 29, 1994
Sold by
Miron Juan and Miron Marta
Bought by
Rodriguez Ma Leonor Lau
Home Financials for this Owner
Home Financials are based on the most recent Mortgage that was taken out on this home.
Original Mortgage
$83,600
Interest Rate
7.71%
Mortgage Type
Assumption
Create a Home Valuation Report for This Property
The Home Valuation Report is an in-depth analysis detailing your home's value as well as a comparison with similar homes in the area
Home Values in the Area
Average Home Value in this Area
Purchase History
| Date | Buyer | Sale Price | Title Company |
|---|---|---|---|
| Ezco Investments Llc | -- | None Listed On Document | |
| Rodriguez Ma Leonor Lau | -- | Chicago Title | |
| Ostinelli Stephen | -- | American Title Company | |
| Rodriguez Ma Leonor Lau | -- | -- | |
| Thoms Steven Lester | -- | -- |
Source: Public Records
Mortgage History
| Date | Status | Borrower | Loan Amount |
|---|---|---|---|
| Previous Owner | Ostinelli Stephen | $89,900 | |
| Previous Owner | Thoms Steven Lester | $83,600 |
Source: Public Records
Tax History
| Year | Tax Paid | Tax Assessment Tax Assessment Total Assessment is a certain percentage of the fair market value that is determined by local assessors to be the total taxable value of land and additions on the property. | Land | Improvement |
|---|---|---|---|---|
| 2025 | $5,329 | $288,231 | $50,000 | $238,231 |
| 2024 | $4,795 | $289,870 | $50,000 | $239,870 |
| 2023 | $4,795 | $259,510 | $50,000 | $209,510 |
| 2022 | $5,008 | $247,840 | $50,000 | $197,840 |
| 2021 | $4,176 | $191,430 | $12,600 | $178,830 |
| 2020 | $4,114 | $180,600 | $12,600 | $168,000 |
| 2019 | $4,238 | $180,000 | $12,600 | $167,400 |
| 2018 | $4,003 | $170,020 | $12,600 | $157,420 |
| 2017 | $4,242 | $177,960 | $12,600 | $165,360 |
| 2016 | $3,953 | $165,850 | $12,600 | $153,250 |
| 2015 | $3,375 | $162,570 | $12,600 | $153,250 |
| 2014 | $3,375 | $147,790 | $12,600 | $137,360 |
Source: Public Records
Map
Nearby Homes
- 9 S Brook Pebble Ct
- 30 N Drifting Leaf Ct
- 37 Rockfern Ct
- 19 Evening Song Ct
- 43 Country Forest Ct
- 56 N Morningwood Ct
- 49 Country Forest Ct
- 10 S Greenbud Ct
- 138 N Dreamweaver Cir
- 22 S Rain Forest Ct
- 3 Rain Walk Ct
- 22 Camberwell Ct
- 19 Tulip Hill Ct
- 34 Green Bough Ct
- 1251 Pruitt Rd
- 713 Sawdust Rd
- 118 Angel Leaf Rd
- 4 Sawmill Grove Ln
- 1231 Pruitt Rd
- 1237 Pruitt Rd
- 22 S Drifting Leaf Ct
- 16 S Drifting Leaf Ct
- 15 S Brook Pebble Ct
- 11 S Brook Pebble Ct
- 26 S Drifting Leaf Ct
- 19 S Brook Pebble Ct
- 15 S Drifting Leaf Ct
- 19 S Drifting Leaf Ct
- 23 S Brook Pebble Ct
- 28 S Drifting Leaf Ct
- 15 N Drifting Leaf Ct
- 14 N Drifting Leaf Ct
- 27 S Brook Pebble Ct
- 23 S Drifting Leaf Ct
- 32 S Drifting Leaf Ct
- 16 S Brook Pebble Ct
- 20 S Brook Pebble Ct
- 18 N Drifting Leaf Ct
- 24 Rockfern Ct
- 12 S Brook Pebble Ct
Your Personal Tour Guide
Ask me questions while you tour the home.