Estimated Value: $526,206 - $615,000
--
Bed
1
Bath
2,907
Sq Ft
$197/Sq Ft
Est. Value
About This Home
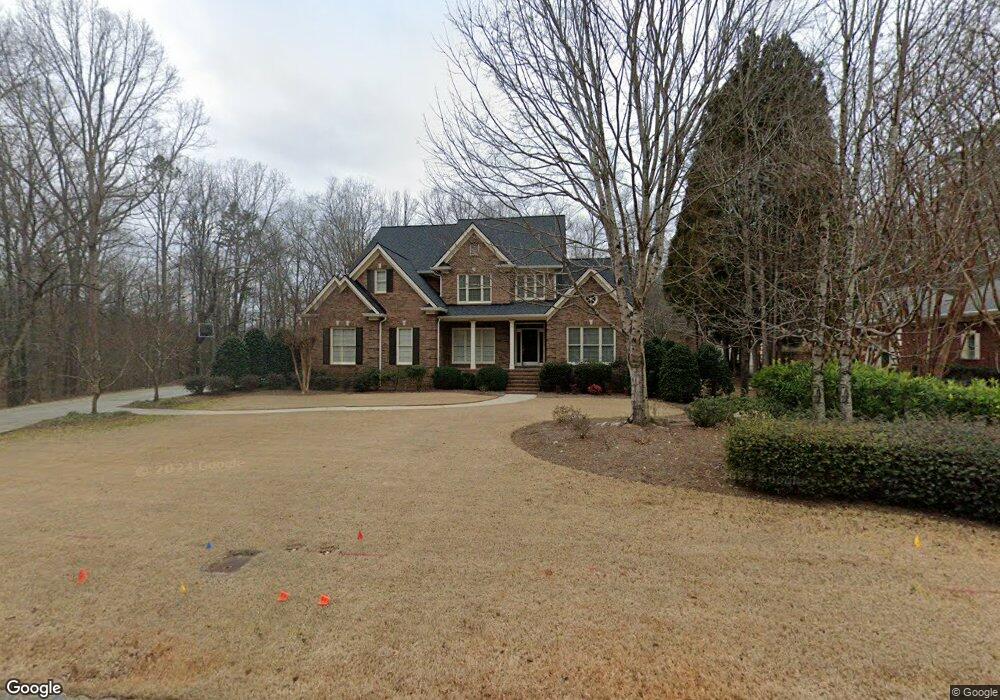
This home is located at 20 S Ivy Ridge Rd SE, Rome, GA 30161 and is currently estimated at $572,552, approximately $196 per square foot. 20 S Ivy Ridge Rd SE is a home located in Floyd County with nearby schools including Dan McCarty Middle School, Rome High School, and St. Mary School.
Ownership History
Date
Name
Owned For
Owner Type
Purchase Details
Closed on
Sep 2, 2021
Sold by
Master Steve A
Bought by
Masters Vickie J and Masters Steven A
Current Estimated Value
Home Financials for this Owner
Home Financials are based on the most recent Mortgage that was taken out on this home.
Original Mortgage
$250,000
Outstanding Balance
$210,169
Interest Rate
2.7%
Mortgage Type
New Conventional
Estimated Equity
$362,383
Purchase Details
Closed on
Jul 8, 2003
Sold by
Masters Steve A and Masters Vickie J
Bought by
Masters Steve A
Purchase Details
Closed on
Jan 25, 2002
Sold by
Masters Steve A
Bought by
Masters Steve A and Masters Vickie J
Purchase Details
Closed on
Jan 26, 2001
Sold by
Developer Inc & Toles Temple & Wright In
Bought by
Robinson M Wayne Builder/ Developer Inc
Purchase Details
Closed on
Jan 6, 1997
Bought by
Robinson M Wayne Builder
Create a Home Valuation Report for This Property
The Home Valuation Report is an in-depth analysis detailing your home's value as well as a comparison with similar homes in the area
Home Values in the Area
Average Home Value in this Area
Purchase History
| Date | Buyer | Sale Price | Title Company |
|---|---|---|---|
| Masters Vickie J | -- | -- | |
| Masters Steve A | -- | -- | |
| Masters Steve A | -- | -- | |
| Masters Steve A | $285,000 | -- | |
| Robinson M Wayne Builder/ Developer Inc | $27,400 | -- | |
| Robinson M Wayne Builder | -- | -- | |
| Developer Inc & Toles Temple & Wright In | -- | -- |
Source: Public Records
Mortgage History
| Date | Status | Borrower | Loan Amount |
|---|---|---|---|
| Open | Masters Vickie J | $250,000 |
Source: Public Records
Tax History Compared to Growth
Tax History
| Year | Tax Paid | Tax Assessment Tax Assessment Total Assessment is a certain percentage of the fair market value that is determined by local assessors to be the total taxable value of land and additions on the property. | Land | Improvement |
|---|---|---|---|---|
| 2024 | $4,693 | $209,317 | $16,380 | $192,937 |
| 2023 | $4,661 | $203,772 | $16,380 | $187,392 |
| 2022 | $4,869 | $173,194 | $15,600 | $157,594 |
| 2021 | $4,458 | $145,391 | $15,600 | $129,791 |
| 2020 | $4,386 | $139,512 | $15,600 | $123,912 |
| 2019 | $4,243 | $133,502 | $15,600 | $117,902 |
| 2018 | $4,131 | $127,117 | $15,600 | $111,517 |
| 2017 | $3,954 | $116,905 | $15,600 | $101,305 |
| 2016 | $3,935 | $115,200 | $15,600 | $99,600 |
| 2015 | $3,823 | $120,290 | $15,600 | $104,690 |
| 2014 | $3,823 | $120,290 | $15,600 | $104,690 |
Source: Public Records
Map
Nearby Homes
- 11 Breckenridge Rd SE
- 100 Valley Brook Dr SE
- 4 Covey Rise Dr SE
- 8 Covey Rise Dr SE
- 12 Covey Rise Dr SE
- 9 Heather Rd SE
- 4 Bridgeview Dr SE
- 11 Surrey Trail SE
- 38 Busby Dr SE
- 20 Covey Rise Dr SE
- 36 Busby Dr SE
- 4 Coach Trail SE
- 30 Covey Rise Dr SE
- 14 Mitchell Cir SE
- 26 Maplewood Square SE
- 13 E Lakeshore Dr SE
- 13 Parkway Dr SE
- 230 Old Freeman Ferry Rd SE
- 227 W Lakeshore Dr SE
- 22 Robin Hood Rd NE
- 18 S Ivy Ridge Rd SE
- 22 S Ivy Ridge Rd SE
- 16 S Ivy Ridge Rd SE
- 2 Brogdon Ct SE
- 2 Brogdon Ct SE Unit /10,11
- 19 S Ivy Ridge Rd SE
- 21 S Ivy Ridge Rd SE
- 17 S Ivy Ridge Rd SE
- 0 Brogdon Ct SE Unit 9015843
- 14 S Ivy Ridge Rd SE
- 15 S Ivy Ridge Rd SE
- 4 Brogdon Ct SE
- N S Ivy Ridge Rd SE Unit 3
- S S Ivy Ridge Rd SE Unit 19
- S S Ivy Ridge Rd SE Unit 16
- S S Ivy Ridge Rd SE Unit 17
- S S Ivy Ridge Rd SE Unit 26
- S S Ivy Ridge Rd SE
- 25 S Ivy Ridge Rd SE
- 12 S Ivy Ridge Rd SE