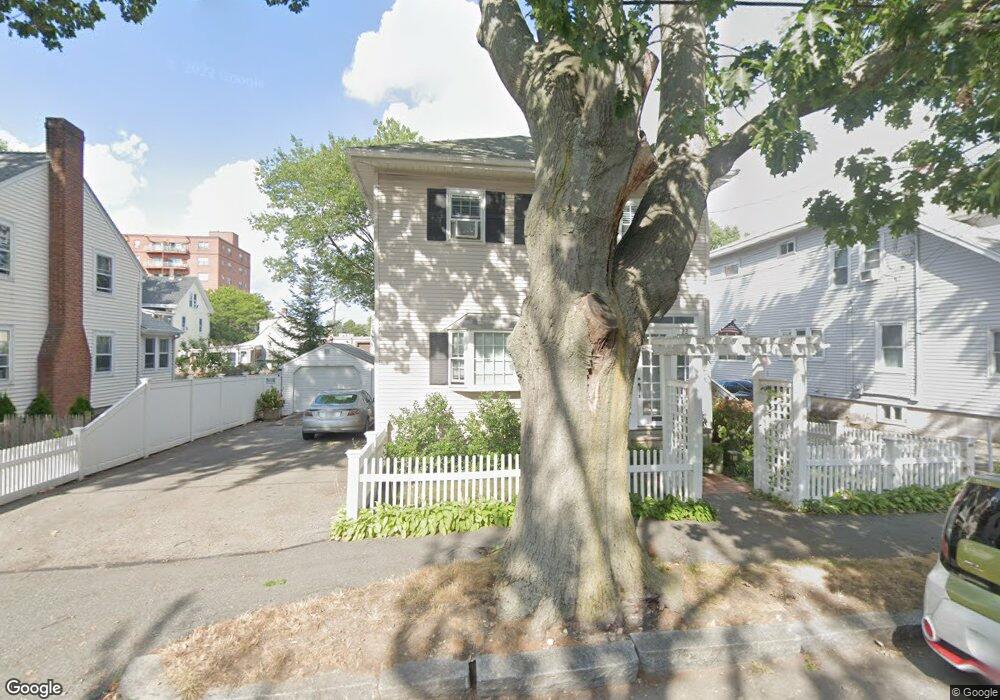
20 Safford St Quincy, MA 02171
Montclair NeighborhoodEstimated Value: $685,000 - $1,079,000
2
Beds
2
Baths
2,000
Sq Ft
$449/Sq Ft
Est. Value
About This Home
This home is located at 20 Safford St, Quincy, MA 02171 and is currently estimated at $898,430, approximately $449 per square foot. 20 Safford St is a home located in Norfolk County with nearby schools including Montclair Elementary School, Atlantic Middle School, and North Quincy High School.
Ownership History
Date
Name
Owned For
Owner Type
Purchase Details
Closed on
Sep 15, 2025
Sold by
Rule Christopher R
Bought by
20-22 Safford Street Llc
Current Estimated Value
Purchase Details
Closed on
Aug 14, 1998
Sold by
Norling Clifford W
Bought by
Rule Christopher R
Home Financials for this Owner
Home Financials are based on the most recent Mortgage that was taken out on this home.
Original Mortgage
$120,750
Interest Rate
6.94%
Mortgage Type
Purchase Money Mortgage
Create a Home Valuation Report for This Property
The Home Valuation Report is an in-depth analysis detailing your home's value as well as a comparison with similar homes in the area
Home Values in the Area
Average Home Value in this Area
Purchase History
| Date | Buyer | Sale Price | Title Company |
|---|---|---|---|
| 20-22 Safford Street Llc | -- | -- | |
| Rule Christopher R | $161,000 | -- |
Source: Public Records
Mortgage History
| Date | Status | Borrower | Loan Amount |
|---|---|---|---|
| Previous Owner | Rule Christopher R | $28,740 | |
| Previous Owner | Rule Christopher R | $120,750 | |
| Closed | Rule Christopher R | $32,000 |
Source: Public Records
Tax History Compared to Growth
Tax History
| Year | Tax Paid | Tax Assessment Tax Assessment Total Assessment is a certain percentage of the fair market value that is determined by local assessors to be the total taxable value of land and additions on the property. | Land | Improvement |
|---|---|---|---|---|
| 2025 | $8,428 | $731,000 | $333,100 | $397,900 |
| 2024 | $8,126 | $721,000 | $333,100 | $387,900 |
| 2023 | $7,716 | $693,300 | $317,300 | $376,000 |
| 2022 | $7,383 | $616,300 | $275,900 | $340,400 |
| 2021 | $7,351 | $605,500 | $262,800 | $342,700 |
| 2020 | $7,325 | $589,300 | $262,800 | $326,500 |
| 2019 | $6,953 | $554,000 | $245,600 | $308,400 |
| 2018 | $6,571 | $492,600 | $227,400 | $265,200 |
| 2017 | $6,629 | $467,800 | $216,500 | $251,300 |
| 2016 | $5,965 | $415,400 | $188,300 | $227,100 |
| 2015 | $5,647 | $386,800 | $171,200 | $215,600 |
| 2014 | $4,935 | $332,100 | $163,000 | $169,100 |
Source: Public Records
Map
Nearby Homes
- 39 Fayette St Unit 102
- 115 W Squantum St Unit 810
- 115 W Squantum St Unit 907
- 204 Farrington St
- 143 Arlington St
- 511 Hancock St Unit 207
- 21 Linden St Unit 417
- 522 Hancock St
- 1 Edwin St Unit C
- 150 Hancock St Unit 102
- 85 Myrtle St Unit 105
- 94 Newbury Ave Unit 100
- 43 Ellington Rd
- 444 W Squantum St
- 77 Botolph St
- 260 Elmwood Ave
- 129 Beale St
- 276 Belmont St
- 57 Quincy Shore Dr Unit 614
- 57 Quincy Shore Dr Unit PH South
- 24 Safford St
- 16 Safford St
- 33 Farrington St
- 14 Safford St
- 23 Safford St
- 23 Safford St Unit 1
- 23 Safford St
- 23 Safford St
- 31 Farrington St
- 37 Farrington St
- 19 Safford St
- 15 Safford St
- 41 Farrington St
- 41 Farrington St Unit 1
- 25 Farrington St
- 25 Farrington St Unit 2
- 8 Safford St
- 8 Safford St Unit SF
- 25 Safford St Unit 2
- 25 Safford St